 Facebook
 Twitter
 Pinterest
 Copy Link
How’s the Market? Q3 2022 Real Estate Review

While still considered a seller’s market, our July-September home sale activity signaled the return of some much-needed balance. Seattle and Eastside home prices still posted year-over-year gains in Q3, but rising interest rates markedly slowed the pace of both listings and sales. Houses also stayed on the market longer than we saw during the frenzy earlier this year—the average Seattle home took 17 days to sell, while Eastside homes averaged 25 days to sell. Buyers have a great opportunity to negotiate better terms now with an eye out to refinance when interest rates come down in the future.
Click or scroll down to find your area report:
Seattle | Eastside | Mercer Island | Condos | Waterfront
SEATTLE
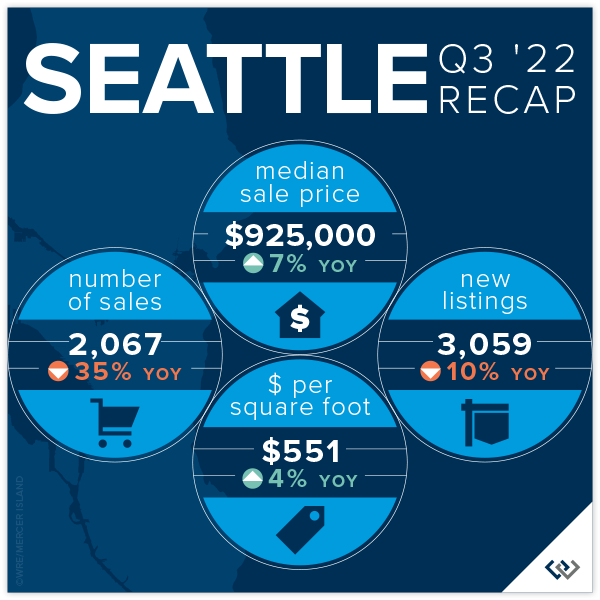
There is a lot of good news in Seattle these days: Progress is being made in taking back downtown, the West Seattle Bridge is open AND real estate prices are UP year over year.
Transaction volume is down 35% across the city, which we can likely attribute to the volatility in interest rates, but listing volume is also down 10%. This is comforting! Supply and demand rules the market, and the last thing this balancing market needs is more inventory. We think this drop in seller enthusiasm is likely caused by the golden handcuffs of their historically low interest rates and refinance boom: even if your home isn’t meeting your needs these days, that 2.75% interest rate might be hard to give up.
Seattle’s average list/sold price ratio is 97%. This means if you listed your home for $1,000,000 you could expect to sell for $970,000 in Q3 of this year. Compare this with 82% on the Eastside. Seattle home sellers are more realistic and less affected by the price bloat of the last several years. We didn’t boom as hard, and we may not feel the impacts of a market balance as sharply either.
Click here for the full report and neighborhood-by-neighborhood statistics!

EASTSIDE
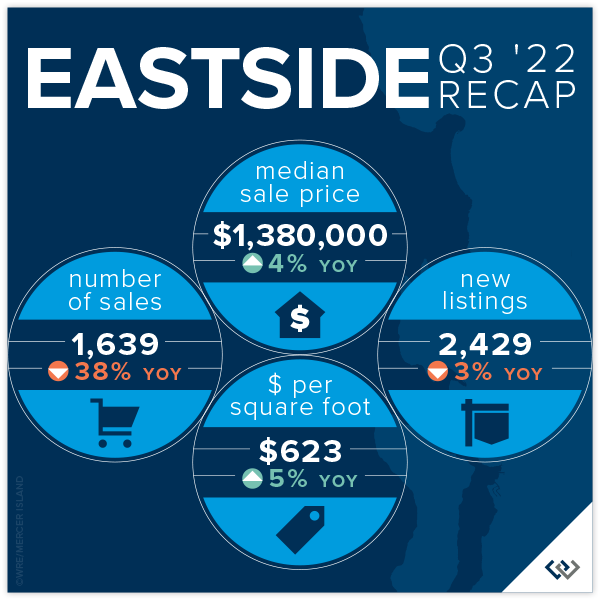
While we’re finally seeing the numbers reflect what the market has been feeling since May, it’s not as dire as one might think. Sales volume has slowed 38% year over year (based on total transaction count). However, new listings are also down (3%) which means the market reaching its peak has not sparked a sell off. This should keep our new normal buzzing along at pace similar to 2018 and 2019. Great homes that are priced right will sell—21% of homes sold above asking price and 40% of homes sold in the first 10 days.
Median list price is down 6% while median sales price is down 14.5%, which means homeowners looking to sell on the Eastside now have some data points to help them with realistic expectations of how to find the market. Average days on market is 25, which is higher than it’s been since Q1 of 2020! This is still slightly under the 6-year average. Don’t be tempted to think that there is something wrong with a home just because it has been on the market for a month; there are a lot of quality homes ready for their new owners.
The news of the day is interest rates. Heavy volatility in the markets and the administration’s drive to stem inflation have caused many buyers to pull out of the market. If you’re thinking you’ll wait for lower rates AND lower prices, you might be dreaming—if rates come down next year as predicted it will likely spur activity on. Our best advice: THIS is the market you’ve been waiting for. As a buyer you have choice, time and negotiating power for the first time since 2018. Capitalize! Then, refinance later.
Click here for the full report and neighborhood-by-neighborhood statistics!

MERCER ISLAND
Given the broader local news, we might expect doom and gloom from Q3 stats—this expert sees lots of opportunity and much needed stabilization after the crazy COVID boom. While median prices have fallen 1% year over year, the average price per square foot is actually UP. What does this mean? Comparing a median with an average is always a little tricky, but this likely points to a slowdown in the sale of larger homes.
To me, the better signs of market predictability are the months supply of inventory for the quarter (about 6 weeks for both condos and single family) and the average days on market (18 for sf and 57 for condo). These are all relatively healthy benchmarks, even though they’re markedly higher than in previous quarters. This is what’s causing media to report doom and gloom: inventory is up sharply (there was ONE active listing at the end of Q4 2021 vs 44 at the end of Q3 2022) and pending sales are down (57 vs. 94 last year in the same time period). When you compare our current numbers to any time period outside of the last two years, we’re faring very well!
The news of the day is interest rates. Heavy volatility in the markets and the administration’s drive to stem inflation have caused many buyers to pull out of the market. If you’re thinking you’ll wait for lower rates AND lower prices, you might be dreaming—if rates come down next year as predicted it will likely spur activity on. Our best advice: THIS is the market you’ve been waiting for. As a buyer you have choice, time and negotiating power for the first time since 2018. Capitalize! Then, refinance later.

Click here for the full report and neighborhood-by-neighborhood statistics!

CONDOS – SEATTLE & EASTSIDE
Condos remain the tortoise as opposed to the hare like residential markets of 2020-early 2022. Slow and steady will definitely win this race as the affordability of homeownership shrinks with rising interest rates. Looking at combined condo data (Eastside + Seattle), months supply of inventory is down to about 6 weeks from 2 months last quarter. Low months supply of inventory and low cumulative days on market (23) are two of the leading indicators of market health, and both are as low or lower as they’ve been in the recent past.
Condo prices are also holding strong with no change to the average $ per square foot in Seattle and an overall 5% rise in median sale price year over year. The Eastside tells an even slightly better story: a 9% rise in $ per square foot and a 6% rise in median sale price despite a 41% year-over-year drop in the number of transactions.
Keep rooting for the tortoise. This is a necessary niche in our marketplace. The first rung on the property ladder is condos again for the first time in a long time, and we really hope our Gen Z and Millennial buyers take the leap!
Check out area-by-area details the full condo report.

WATERFRONT
The most affordable place to buy waterfront this quarter was Beach Dr in West Seattle at a closed sale price of $1,800,000 for 22’ of waterfront on an 11,000 sq. ft. lot. The largest piece of shoreline overall was 172 feet in Medina on Lake Washington, which commanded a sales price of $17,800,000.
This brief overview of the entire Seattle-Eastside private waterfront market, including Mercer Island and Lake Sammamish, illustrates the trends occurring in our region over time. This data is interesting and insightful but cannot replace an in-depth waterfront analysis provided by a savvy broker with years of local waterfront experience.


Find a Home | Sell Your Home | Property Research
Neighborhoods | Market Reports | Our Team
We earn the trust and loyalty of our brokers and clients by doing real estate exceptionally well. The leader in our market, we deliver client-focused service in an authentic, collaborative, and transparent manner and with the unmatched knowledge and expertise that comes from decades of experience.
2737 77th Ave SE, Mercer Island, WA 98040 | (206) 232-0446
mercerisland@windermere.com
© Copyright 2022, Windermere Real Estate/Mercer Island. Information and statistics derived from Northwest Multiple Listing Service and deemed accurate but not guaranteed.
How’s the Market? Q3 Real Estate Review

The frenetic pace of Seattle-area real estate continued in Q3, with the number of sales and median sales prices both up across the region compared to this time last year. Seattle condo sales saw a healthy year-over-year jump as they continued to recover from the COVID slump we saw in 2020.
While buyers still contended with a lack of inventory and stiff competition for available homes, our continued low interest rates were the silver lining. Those obtaining financing were buoyed up by lower mortgage payments and increased buying power compared to times when rates are higher.
Click or scroll down to find your area report:
Seattle | Eastside | Mercer Island | Condos | Waterfront
SEATTLE
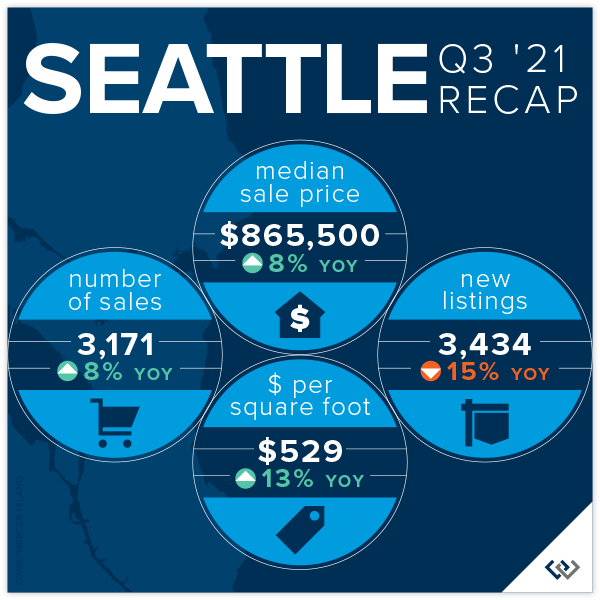
Seattle’s Median Sale Price increased by 8% to $865,500 (up from $800,000 in Q3 2020). Neighborhoods in Lake Forest Park-Kenmore (+19%), Shoreline (+13%), North Seattle (+10%), West Seattle (+10%), and Queen Anne-Magnolia (+9%) outperformed the average while South Seattle (+8%) stayed on par and Ballard-Green Lake (+5%) and Central Seattle (+2%) lagged behind.
There was an 8% increase in the number of Seattle homes sold in the third quarter of 2021 (3171) compared to Q3 2020 (2929) despite the tight supply of homes for sale. Central Seattle (+20%) and North Seattle (+18%) had the largest increases over Q3 2020 in number of homes sold.
79% of all Seattle homes, and 28% of those priced above $1 million, sold at or above the list price. The average of all homes sold closed at a price 4% more than list. Price increases were even more dramatic when homes sold in their first ten days on the market—with an average sale price of 7% above list price. The most competitive neighborhoods were North Seattle and South Seattle, with first 10-day sales averaging 9% and 8% above list price, respectively.
Click here for the full report and neighborhood-by-neighborhood statistics!

EASTSIDE
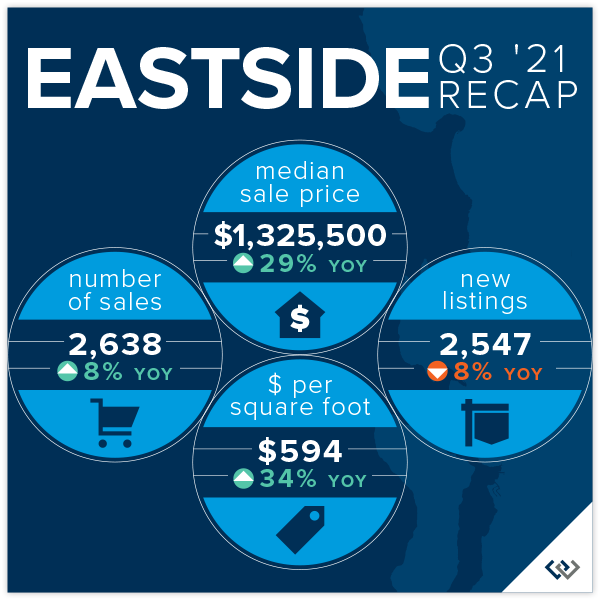
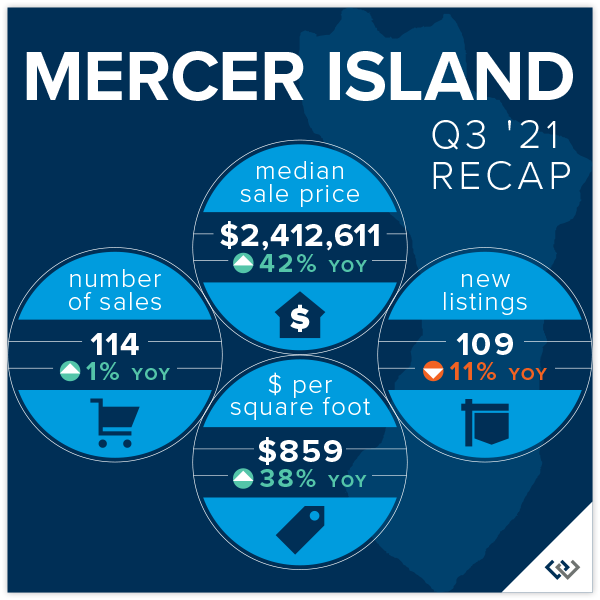
The Eastside’s Median Sale Price was $1,325,500 in the third quarter of 2021, up 29% over Q3 2020 ($1,025,100). Buyer demand outpacing the supply of homes for sale was the biggest factor fueling this increase. Mercer Island, (+42%), Redmond (+32%), Sammamish (+32%), and South Eastside (+32%) saw the largest gains, while Woodinville (+23%) had the smallest year-over-year increase.
87% of all Eastside homes, and 65% of homes priced above one million dollars, sold for at or above their list price. With 59% fewer homes for sale than in Q3 2020, the entire Eastside market remained ultra-competitive. The average of all homes sold was 7% above list price. Homes sold within the first ten days went for an average of 11% above list price. The most competitive neighborhoods were East Bellevue and South Eastside, with first 10-day sales averaging 13% and 12% above list price, respectively.
The Eastside market saw Months of Inventory (the number of months it would take to sell all homes currently for sale) remain at historical lows of between 0.3 and 0.4 months. Many Eastside communities have had only a handful of homes for sale at any one time.
Click here for the full report and neighborhood-by-neighborhood statistics!

MERCER ISLAND
Fewer than two dozen homes for sale on the Island at any given time has led to a continued ultra-competitive market and unpredictable shifts in median sale price as a result. It’s worth noting that a few very high-end waterfront home sales skewed the median sale price upward as compared to last year.
In the third quarter of 2021, 75% of all homes sold at or above their listed price. Sellers who prepped and priced their homes competitively reaped huge rewards from bidding wars—those that sold in the first 10 days on market closed for an average of 10% above their list price.
On the other hand, those properties that were not immediately snapped up tended to sell at a discount. Homes on the market 11-30 days sold for an average of 3% below their list price, while homes on the market longer than 30 days sold for an average of 5% below their list price. Pricing and condition tended to separate the “haves” from the “have nots” when it came to selling quickly.
Click here for the full report and neighborhood-by-neighborhood statistics!

CONDOS – SEATTLE & EASTSIDE
Condos did quite well overall in the third quarter of 2021 as single-family home markets became more competitive, and in some cases, unattainable.
Seattle condos saw a 3% increase (to $492,750) and Eastside condos saw a 10% increase (to $551,619) in Median Sale Price compared to Q3 2020.
62% of Seattle condos and 78% of Eastside condos sold at or above their listed price. Those sold in the first 10 days on the market went for an average of 2% and 5% above their list price, respectively.
Check out area-by-area details the full condo report.

WATERFRONT
The waterfront home market continues to see incredible buyer demand while also suffering from an extreme shortage of available homes for sale. Nearly every waterfront home listed for sale sold in record time, some for jaw-dropping prices. The Eastside had 23 waterfront home sales in the third quarter of 2021 while Seattle had 22 Q3 waterfront sales, Mercer Island had 15, and Lake Sammamish had 10 waterfront sales. More than half of waterfront homes listed for sale went under contract in mere days, with an average market time still a fraction of that of a more typical year.
As an indicator of demand in the luxury segment, with few outliers, most homes sold near to or above their list price—something that historically has rarely happened in this sector.
This brief overview of the entire Seattle-Eastside private waterfront market, including Mercer Island and Lake Sammamish, illustrates the trends occurring in our region over time. This data is interesting and insightful but cannot replace an in-depth waterfront analysis provided by a savvy broker with years of local waterfront experience.

Find a Home | Sell Your Home | Property Research
Neighborhoods | Market Reports | Our Team
We earn the trust and loyalty of our brokers and clients by doing real estate exceptionally well. The leader in our market, we deliver client-focused service in an authentic, collaborative, and transparent manner and with the unmatched knowledge and expertise that comes from decades of experience.
2737 77th Ave SE, Mercer Island, WA 98040 | (206) 232-0446
mercerisland@windermere.com
© Copyright 2021, Windermere Real Estate/Mercer Island. Information and statistics derived from Northwest Multiple Listing Service and deemed accurate but not guaranteed.


