Market Reports December 14, 2022

Matthew Gardner’s Top 10 Predictions for 2023


This video shows Windermere Chief Economist Matthew Gardner’s Top 10 Predictions for 2023. Each month, he analyzes the most up-to-date U.S. housing data to keep you well-informed about what’s going on in the real estate market.


1. There Is No Housing Bubble

Mortgage rates rose steeply in 2022 which, when coupled with the massive run-up in home prices, has some suggesting that we are recreating the housing bubble of 2007. But that could not be further from the truth.

Over the past couple of years, home prices got ahead of themselves due to a perfect storm of massive pandemic-induced demand and historically low mortgage rates. While I expect year-over-year price declines in 2023, I don’t believe there will be a systemic drop in home values. Furthermore, as financing costs start to pull back in 2023, I expect that will allow prices to resume their long-term average pace of growth.

2. Mortgage Rates Will Drop

Mortgage rates started to skyrocket at the start of 2022 as the Federal Reserve announced their intent to address inflation. While the Fed doesn’t control mortgage rates, they can influence them, which we saw with the 30-year rate rising from 3.2% in early 2022 to over 7% by October.

Their efforts so far have yet to significantly reduce inflation, but they have increased the likelihood of a recession in 2023. Therefore, early in the year I expect the Fed to start pulling back from their aggressive policy stance, and this will allow rates to begin slowly stabilizing. Rates will remain above 6% until the fall of 2023 when they should dip into the high 5% range. While this is higher than we have become used to, it’s still more than 2% lower than the historic average.

3. Don’t Expect Inventory to Grow Significantly

Although inventory levels rose in 2022, they are still well below their long-term average. In 2023 I don’t expect a significant increase in the number of homes for sale, as many homeowners do not want to lose their low mortgage rate. In fact, I estimate that 25-30 million homeowners have mortgage rates around 3% or lower. Of course, homes will be listed for sale for the usual reasons of career changes, death, and divorce, but the 2023 market will not have the normal turnover in housing that we have seen in recent years.

4. No Buyer’s Market But a More Balanced One

With supply levels expected to remain well below normal, it’s unlikely that we will see a buyer’s market in 2023. A buyer’s market is usually defined as having more than six months of available inventory, and the last time we reached that level was in 2012 when we were recovering from the housing bubble. To get to six months of inventory, we would have to reach two million listings, which hasn’t happened since 2015. In addition, monthly sales would have to drop below 325,000, a number we haven’t seen in over a decade. While a buyer’s market in 2023 is unlikely, I do expect a return to a far more balanced one.

5. Sellers Will Have to Become More Realistic

We all know that home sellers have had the upper hand for several years, but those days are behind us. That said, while the market has slowed, there are still buyers out there. The difference now is that higher mortgage rates and lower affordability are limiting how much buyers can pay for a home. Because of this, I expect listing prices to pull back further in the coming year, which will make accurate pricing more important than ever when selling a home.

6. Workers Return to Work (Sort of)

The pandemic’s impact on where many people could work was profound, as it allowed buyers to look further away from their workplaces and into more affordable markets. Many businesses are still determining their long-term work-from-home policies, but in the coming year I expect there will be more clarity for workers. This could be the catalyst for those who have been waiting to buy until they know how often they’re expected to work at the office.

7. New Construction Activity Is Unlikely to Increase

Permits for new home construction are down by over 17% year over year, as are new home starts. I predict that builders will pull back further in 2023, with new starts coming in at a level we haven’t seen since before the pandemic.

Builders will start seeing some easing in the supply chain issues that hit them hard over the past two years, but development costs will still be high. Trying to balance homebuilding costs with what a consumer can pay (given higher mortgage rates) will likely lead builders to slow activity. This will actually support the resale market, as fewer new homes will increase the demand for existing homes.

8. Not All Markets Are Created Equal

Markets where home price growth rose the fastest in recent years are expected to experience a disproportionate swing to the downside. For example, markets in areas that had an influx of remote workers, who flocked to cheaper housing during the pandemic, will likely see prices fall by a greater percentage than other parts of the country. That said, even those markets will start to see prices stabilize by the end of 2023 and resume a more reasonable pace of price growth.

9. Affordability Will Continue to Be a Major Issue

In most markets, home prices will not increase in 2023, but any price drop will not be enough to make housing more affordable. And with mortgage rates remaining higher than they’ve been in over a decade, affordability will continue to be a problem in the coming year, which is a concerning outlook for first-time buyers.

Over the past two years, many renters have had aspirations of buying but the timing wasn’t quite right for them. With both prices and mortgage rates spiraling upward in 2022, it’s likely that many renters are now in a situation where the dream of homeownership has gone. That’s not to say they will never be able to buy a home, just that they may have to wait a lot longer than they had hoped.

10. Government Needs to Take Housing More Seriously

Over the past two years, the market has risen to such an extent that it has priced out millions of potential home buyers. With a wave of demand coming from Millennials and Gen Z, the pace of housing production must increase significantly, but many markets simply don’t have enough land to build on. This is why I expect more cities, counties, and states to start adjusting their land use policies to free up more land for housing.

But it’s not just land supply that can help. Elected officials can assist housing developers by utilizing Tax Increment Financing tools, whereby the government reimburses a private developer as incremental taxes are generated from housing development. There are many tools like this at the government’s disposal to help boost housing supply, and I sincerely hope that they start to take this critical issue more seriously.


About Matthew Gardner

As Chief Economist for Windermere Real Estate, Matthew Gardner is responsible for analyzing and interpreting economic data and its impact on the real estate market on both a local and national level. Matthew has over 30 years of professional experience both in the U.S. and U.K.

In addition to his day-to-day responsibilities, Matthew sits on the Washington State Governors Council of Economic Advisors; chairs the Board of Trustees at the Washington Center for Real Estate Research at the University of Washington; and is an Advisory Board Member at the Runstad Center for Real Estate Studies at the University of Washington where he also lectures in real estate economics.


This article originally appeared on the Windermere blog November 14th, 2022. Written by: Matthew Gardner.

Mercer island blog, windermere mercer island, windermere real estate, seattle blog, live on mercer, live on guides, community information, neighborhood information, real estate, mercer island community, mercer island community blog, mercer island blogger, mi reporter, mercer island real estate info,

Find a Home | Sell Your Home | Property Research

Neighborhoods | Market Reports | Our Team

We earn the trust and loyalty of our brokers and clients by doing real estate exceptionally well. The leader in our market, we deliver client-focused service in an authentic, collaborative, and transparent manner and with the unmatched knowledge and expertise that comes from decades of experience.

2737 77th Ave SE, Mercer Island, WA 98040 | (206) 232-0446
mercerisland@windermere.com

© Copyright 2022, Windermere Real Estate/Mercer Island.


Market Reports October 13, 2022

How’s the Market? Q3 2022 Real Estate Review

Q3 2022 Market Review


While still considered a seller’s market, our July-September home sale activity signaled the return of some much-needed balance.  Seattle and Eastside home prices still posted year-over-year gains in Q3, but rising interest rates markedly slowed the pace of both listings and sales.  Houses also stayed on the market longer than we saw during the frenzy earlier this year—the average Seattle home took 17 days to sell, while Eastside homes averaged 25 days to sell.  Buyers have a great opportunity to negotiate better terms now with an eye out to refinance when interest rates come down in the future.


Click or scroll down to find your area report:

Seattle  |  Eastside  |  Mercer Island  |  Condos  |  Waterfront


SEATTLE

There is a lot of good news in Seattle these days: Progress is being made in taking back downtown, the West Seattle Bridge is open AND real estate prices are UP year over year.


Transaction volume is down 35% across the city, which we can likely attribute to the volatility in interest rates, but listing volume is also down 10%. This is comforting! Supply and demand rules the market, and the last thing this balancing market needs is more inventory. We think this drop in seller enthusiasm is likely caused by the golden handcuffs of their historically low interest rates and refinance boom: even if your home isn’t meeting your needs these days, that 2.75% interest rate might be hard to give up.


Seattle’s average list/sold price ratio is 97%. This means if you listed your home for $1,000,000 you could expect to sell for $970,000 in Q3 of this year. Compare this with 82% on the Eastside. Seattle home sellers are more realistic and less affected by the price bloat of the last several years. We didn’t boom as hard, and we may not feel the impacts of a market balance as sharply either.


Click here for the full report and neighborhood-by-neighborhood statistics!

Seattle Report


↑ Back to top


EASTSIDE

While we’re finally seeing the numbers reflect what the market has been feeling since May, it’s not as dire as one might think. Sales volume has slowed 38% year over year (based on total transaction count). However, new listings are also down (3%) which means the market reaching its peak has not sparked a sell off. This should keep our new normal buzzing along at pace similar to 2018 and 2019. Great homes that are priced right will sell—21% of homes sold above asking price and 40% of homes sold in the first 10 days.


Median list price is down 6% while median sales price is down 14.5%, which means homeowners looking to sell on the Eastside now have some data points to help them with realistic expectations of how to find the market. Average days on market is 25, which is higher than it’s been since Q1 of 2020! This is still slightly under the 6-year average. Don’t be tempted to think that there is something wrong with a home just because it has been on the market for a month; there are a lot of quality homes ready for their new owners.


The news of the day is interest rates. Heavy volatility in the markets and the administration’s drive to stem inflation have caused many buyers to pull out of the market. If you’re thinking you’ll wait for lower rates AND lower prices, you might be dreaming—if rates come down next year as predicted it will likely spur activity on. Our best advice: THIS is the market you’ve been waiting for. As a buyer you have choice, time and negotiating power for the first time since 2018. Capitalize! Then, refinance later.


Eastside Recap

Click here for the full report and neighborhood-by-neighborhood statistics!

Eastside Report


↑ Back to top


MERCER ISLAND

Given the broader local news, we might expect doom and gloom from Q3 stats—this expert sees lots of opportunity and much needed stabilization after the crazy COVID boom. While median prices have fallen 1% year over year, the average price per square foot is actually UP. What does this mean? Comparing a median with an average is always a little tricky, but this likely points to a slowdown in the sale of larger homes.


To me, the better signs of market predictability are the months supply of inventory for the quarter (about 6 weeks for both condos and single family) and the average days on market (18 for sf and 57 for condo). These are all relatively healthy benchmarks, even though they’re markedly higher than in previous quarters. This is what’s causing media to report doom and gloom: inventory is up sharply (there was ONE active listing at the end of Q4 2021 vs 44 at the end of Q3 2022) and pending sales are down (57 vs. 94 last year in the same time period). When you compare our current numbers to any time period outside of the last two years, we’re faring very well!


The news of the day is interest rates. Heavy volatility in the markets and the administration’s drive to stem inflation have caused many buyers to pull out of the market. If you’re thinking you’ll wait for lower rates AND lower prices, you might be dreaming—if rates come down next year as predicted it will likely spur activity on. Our best advice: THIS is the market you’ve been waiting for. As a buyer you have choice, time and negotiating power for the first time since 2018. Capitalize! Then, refinance later.


Mercer Island Recap

Click here for the full report and neighborhood-by-neighborhood statistics!

Mercer Island Report

↑ Back to top


CONDOS – SEATTLE & EASTSIDE

Condos remain the tortoise as opposed to the hare like residential markets of 2020-early 2022. Slow and steady will definitely win this race as the affordability of homeownership shrinks with rising interest rates. Looking at combined condo data (Eastside + Seattle), months supply of inventory is down to about 6 weeks from 2 months last quarter. Low months supply of inventory and low cumulative days on market (23) are two of the leading indicators of market health, and both are as low or lower as they’ve been in the recent past.


Condo prices are also holding strong with no change to the average $ per square foot in Seattle and an overall 5% rise in median sale price year over year. The Eastside tells an even slightly better story: a 9% rise in $ per square foot and a 6% rise in median sale price despite a 41% year-over-year drop in the number of transactions.


Keep rooting for the tortoise. This is a necessary niche in our marketplace. The first rung on the property ladder is condos again for the first time in a long time, and we really hope our Gen Z and Millennial buyers take the leap!


Check out area-by-area details the full condo report.


Condo Report

↑ Back to top


WATERFRONT

The most affordable place to buy waterfront this quarter was Beach Dr in West Seattle at a closed sale price of $1,800,000 for 22’ of waterfront on an 11,000 sq. ft. lot. The largest piece of shoreline overall was 172 feet in Medina on Lake Washington, which commanded a sales price of $17,800,000.


This brief overview of the entire Seattle-Eastside private waterfront market, including Mercer Island and Lake Sammamish, illustrates the trends occurring in our region over time. This data is interesting and insightful but cannot replace an in-depth waterfront analysis provided by a savvy broker with years of local waterfront experience.


Waterfront Report

↑ Back to top


Mercer island blog, windermere mercer island, windermere real estate, seattle blog, live on mercer, live on guides, community information, neighborhood information, real estate, mercer island community, mercer island community blog, mercer island blogger, mi reporter, mercer island real estate info,

Find a Home | Sell Your Home | Property Research

Neighborhoods | Market Reports | Our Team

We earn the trust and loyalty of our brokers and clients by doing real estate exceptionally well. The leader in our market, we deliver client-focused service in an authentic, collaborative, and transparent manner and with the unmatched knowledge and expertise that comes from decades of experience.

2737 77th Ave SE, Mercer Island, WA 98040 | (206) 232-0446
mercerisland@windermere.com

© Copyright 2022, Windermere Real Estate/Mercer Island. Information and statistics derived from Northwest Multiple Listing Service and deemed accurate but not guaranteed.

Market Reports July 13, 2022

How’s the Market? Q2 Real Estate Review

While Seattle and the Eastside are still considered a seller’s market, buyers experienced some much-needed relief in the second quarter with new listings outpacing the number of homes sold. Rising interest rates have initiated a shift toward a more balanced market. Opportunities abound for both sellers (who are still seeing higher sales prices than this time last year) and buyers (who finally have some breathing room to negotiate price and contingencies). We expect this shift to continue with a stabilization of home prices rather than the steep upward trajectory we saw last year.


Click or scroll down to find your area report:

Seattle  |  Eastside  |  Mercer Island  |  Condos  |  Waterfront


SEATTLE

The Seattle real estate market for single family homes is holding steady despite rising interest rates and slowdowns elsewhere in King County! The median sale price is up 9% since the end of 2021 (from $910,000 to $1,000,000). Year over year, the median price rose from $895,000 in Q2 2021 to $1,000,000 in Q2 2022 (also roughly 12%).


Anecdotally, we believe that Seattle continues to gain ground because it remains affordable when compared to the cities and neighborhoods to the east. Eastside median prices rose so sharply over the last two years that it left Seattle “in the dust” as the market leader of the region. As we know, slow and steady wins the race, though there is no way to know yet if this particular race is a marathon or a sprint.


Interest rates nearly doubled in Q2, though that seems to leave Seattle home shoppers undeterred. 86% of the sales in Q2 sold in the first 10 days at an average of 110% of list price.


Seattle Recap

Click here for the full report and neighborhood-by-neighborhood statistics!

Seattle Report


↑ Back to top


EASTSIDE

Relief has finally come to home shoppers on the Eastside! New listings are up 13% year over year. Further, there has been a slide in total number of sales, down 18% year over year. This means there are more choices for anyone who is in the market to buy a home. Price gains remain steady for now, up 22% over Q2 of 2021. This is likely riding the wave of growth in late 2021 and early 2022, but with the higher supply and lower demand this is may be a trend that tapers off in the near future.


Average price per square foot saw its first quarterly drop since Q2 of 2019, down from $713 in Q1 to $685. The overall median price fell from a high of $1,625,000 in Q1 to $1,610,000 in Q2. Even more exciting for home buyers is that (when in competition) the list to sales price ratio is 109%— down from 119% in Q1.


If you’ve thought about selling your home, it’s still a great time. When a home is prepared well and priced right shoppers pay attention. Of the 2177 homes sold in Q2, 84% of those sold in the first 10 days. This isn’t far off of the 90% that was posted in Q1. It is harder to get noticed today than in recent memory—this is where choosing a true professional to partner with is so important! Windermere brokers have their fingers on the pulse and know how to make you stand out in a crowd!


Eastside Recap

Click here for the full report and neighborhood-by-neighborhood statistics!

Eastside Report


↑ Back to top


MERCER ISLAND

Mercer Island continues to be a fabulous place to be a homeowner. Median prices and price per square foot both saw increases over Q1 2022 numbers (6.5% and 5% respectively). Anecdotally, there has been a pace change. We don’t expect that to reflect in the stats until Q3, and even then the numbers are likely to be favorable as we gained so much ground in Q1 of this year.


The data that supports what we’re all feeling can be found in the relationship between number of new listings and number of homes sold. In Q2, there were 116 new listings and 84 sales compared to the same period in 2021 when we had 124 new listings and 102 sales. So, if you’re feeling like inventory is “up,” it’s not because more homeowners are deciding to sell but rather it appears that demand is down. Another way to look at this is that we sold 82% of the active inventory in spring of 2021 but only 72% in 2022. These are healthy numbers but it’s enough of a drop for us to feel it.


If you’re a buyer trying to break in to the Mercer Island market, it’s getting easier. 83% of the 116 new listings sold within the first 10 days for an average of 111% of the asking price. This is the most favorable these numbers have been since 2019. Working with a local pro will be your biggest advantage to determine which homes will sell at a premium and how to get the best deal!


Mercer Island Recap

Click here for the full report and neighborhood-by-neighborhood statistics!

Mercer Island Report

↑ Back to top


CONDOS – SEATTLE & EASTSIDE

Condo average prices have seen their biggest quarterly rise since Q3 of 2016! As home shoppers adjust expectations amidst rising interest rates, the affordability offered by condos is an exciting place to turn. We are thrilled to see condos be a viable option as we recover from the pandemic and buyers return to more densely populated areas.


North Seattle (up 34%) and Capitol Hill (up 10%) are bright spots in the total number of condos sold year over year for Seattle. This makes perfect sense as both areas offer access to our growing light rail system and new retail opportunities that didn’t exist pre-pandemic. Seattle’s total sales year over year remained flat, literally zero, which means these two neighborhoods carried the entire city.


The same data point on the Eastside saw the entire area’s total number of sales fall 27% year over year. West Bellevue (down 51%) and Mercer Island (down 38%) topped the list. Meanwhile, prices on the Eastside are up an average of 20%.


Check out area-by-area details the full condo report.


Condo Report

↑ Back to top


WATERFRONT

Waterfront season is heating up. As expected, inventory is up from Q1 (32 total sales in Q2 v 17 in Q1), but what hasn’t changed is an average of only 6 listings for sale at any one time across all shorelines! Of all of the waterfront shorelines, Mercer Island boasted the lowest days on market with an average of just THREE days. Seattle had the highest days on market, with an average of 41 days.


The most affordable place to buy waterfront this quarter was Beach Dr in West Seattle at a closed sale price of $1,800,000 for 25’ of waterfront on a 17,000 sq. ft. lot. The largest piece of shoreline overall was 177 feet in Issaquah on Lake Sammamish, which commanded a sales price of $11,600,000.


This brief overview of the entire Seattle-Eastside private waterfront market, including Mercer Island and Lake Sammamish, illustrates the trends occurring in our region over time. This data is interesting and insightful but cannot replace an in-depth waterfront analysis provided by a savvy broker with years of local waterfront experience.


Waterfront Report

↑ Back to top


Mercer island blog, windermere mercer island, windermere real estate, seattle blog, live on mercer, live on guides, community information, neighborhood information, real estate, mercer island community, mercer island community blog, mercer island blogger, mi reporter, mercer island real estate info,

Find a Home | Sell Your Home | Property Research

Neighborhoods | Market Reports | Our Team

We earn the trust and loyalty of our brokers and clients by doing real estate exceptionally well. The leader in our market, we deliver client-focused service in an authentic, collaborative, and transparent manner and with the unmatched knowledge and expertise that comes from decades of experience.

2737 77th Ave SE, Mercer Island, WA 98040 | (206) 232-0446
mercerisland@windermere.com

© Copyright 2022, Windermere Real Estate/Mercer Island. Information and statistics derived from Northwest Multiple Listing Service and deemed accurate but not guaranteed.

Home Seller Tips March 8, 2022

Should You Remodel or Sell Your Home As Is?

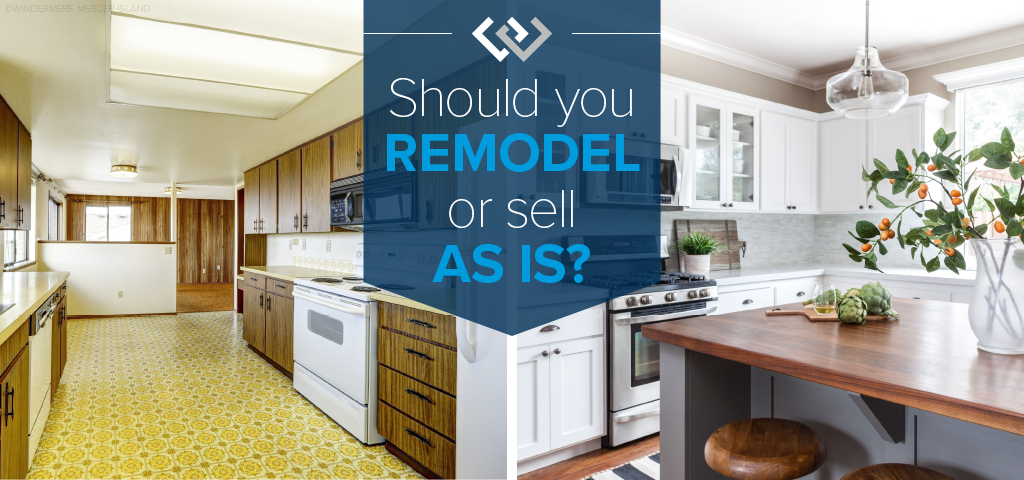
Homeowners who are preparing to sell are often faced with a dilemma about whether to remodel or sell their home in its current state. Each approach has its respective advantages and disadvantages. If you decide to remodel your home, it will likely sell for more; but the increased selling price will come at the cost of financing the remodeling projects. If you decide to sell without remodeling, you won’t spend as much money putting your home on the market, but the concern is whether you’re leaving money on the table.


Should I Remodel or Sell My Home As Is?

To answer this question, it’s important to understand the factors that could influence your decision and to work closely with your agent throughout the process.


Cost Analysis: Home Remodel vs. Selling Your Home As Is

Home Remodel

When you remodel your home before selling, you’re basically making a commitment to spend money to make money. So, it’s important to consider the kind of ROI you can expect from different remodeling projects and how much money you’re willing to spend. Start by discussing these questions with your agent. They can provide you with information on what kinds of remodels other sellers in your area are making and the returns they’re seeing as a result of those upgrades. This will help you determine the price of your home once your remodel is complete.

Then, there’s the question of whether you can complete you remodeling projects DIY or if you’ll need to hire a contractor. If hiring a contractor seems expensive, know that those costs come with the assurance that they will perform quality work and that they have the skill required to complete highly technical projects.

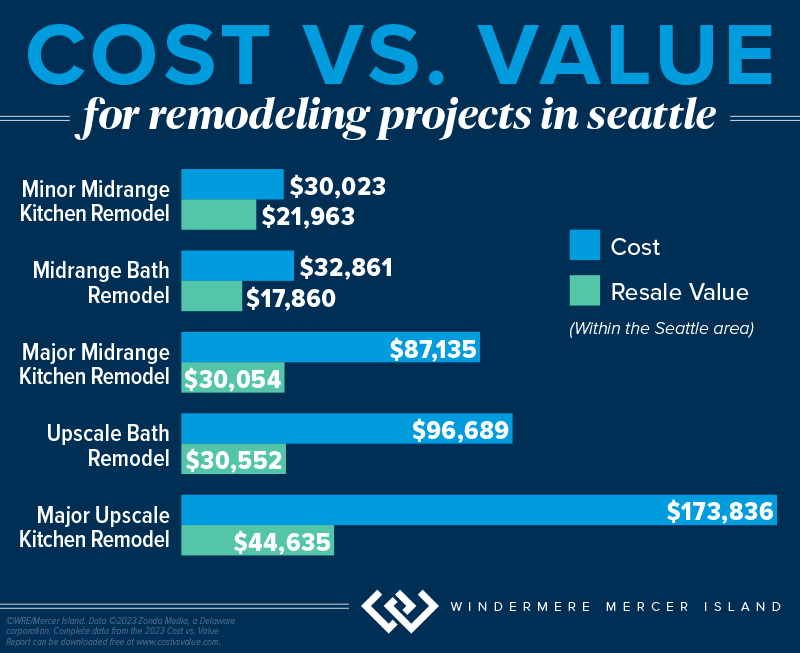
According to the Remodeling 2023 Cost vs. Value Report for Seattle (www.costvsvalue.com1), on average, Seattle-area homeowners paid $32,861 for a midrange bathroom remodel and $30,023 for a minor kitchen remodel, with a 54.4% and 73.2% ROI respectively. This data shows that, for these projects, you can recoup a chunk of your costs, but they may not be the most cost-effective for you. A more budget-friendly approach to upgrading these spaces may look like repainting your kitchen cabinets, swapping out your old kitchen backsplash for a new one, refinishing your bathroom tub, or installing a new showerhead. Other high-ROI remodeling projects may allow you to get more bang for your buck, such as a garage door replacement or installing stone veneer. To appeal to sustainable-minded buyers, consider these 5 Green Upgrades that Increase Your Home Value.


Cost vs. Value for Remodeling Projects in Seattle


Selling Your Home As Is

Deciding not to remodel your home will come with its own pros and cons. By selling as is, you may sell your home for less, but you also won’t incur the cost and headache of dealing with a remodel. And since you’ve decided to sell, you won’t be able to enjoy the fruits of the remodel, anyway. If you sell your home without remodeling, you may forego the ability to pay down the costs of buying a new home with the extra money you would have made from making those upgrades.


Market Conditions: Home Remodel vs. Selling Your Home As Is

Local market conditions may influence your decision of whether to remodel before selling your home. If you live in a seller’s market, there will be high competition amongst buyers due to a lack of inventory. You may want to capitalize on the status of the market by selling before investing time in a remodel since prices are being driven up, anyway. If you take this approach, you’ll want to strategize with your agent, since your home may lack certain features that buyers can find in comparable listings. In a seller’s market, it is still important to make necessary repairs and to stage your home.

In a buyer’s market, there are more homes on the market than active buyers. If you live in a buyer’s market, you may be more inclined to remodel your home before selling to help it stand out amongst the competition.


Timing: Home Remodel vs. Selling Your Home As Is

Don’t forget that there is a third option: to wait. For all the number crunching and market analysis, it simply may not be the right time to sell your home. Knowing that you’ll sell your home at some point in the future—but not right now—will allow you to plan your remodeling projects with more time on your hands which could make it more financially feasible to complete them.

For more information on how you can prepare to sell your home, connect with one of our local agents—we’re always happy to chat about your situation and offer advice.


1©2023 Zonda Media, a Delaware corporation. Complete data from the 2023 Cost vs. Value Report can be downloaded free at www.costvsvalue.com.

Adapted from an article that originally appeared on the Windermere blog January 10, 2022. Written by: Sandy Dodge.


Mercer island blog, windermere mercer island, windermere real estate, seattle blog, live on mercer, live on guides, community information, neighborhood information, real estate, mercer island community, mercer island community blog, mercer island blogger, mi reporter, mercer island real estate info,

Find a Home | Sell Your Home | Property Research

Neighborhoods | Market Reports | Our Team

We earn the trust and loyalty of our brokers and clients by doing real estate exceptionally well. The leader in our market, we deliver client-focused service in an authentic, collaborative, and transparent manner and with the unmatched knowledge and expertise that comes from decades of experience.

2737 77th Ave SE, Mercer Island, WA 98040 | (206) 232-0446
mercerisland@windermere.com

© Copyright 2022, Windermere Real Estate/Mercer Island.


Living & Community November 1, 2021

Give Back This Season

“We make a living by what we get; we make a life by what we give.”

Giving to others can enrich our own lives in ways we never imagined.  With that in mind, here are some of our favorite Seattle-area organizations who are in need of time, resources, toys, and more to help improve the lives of homeless and low-income families in our area. You might also check out these tips on how to make the most of charitable giving. Together we can make the holidays a little brighter for everyone!


YOUTH CARE: Homeless Youth Off the Streets Preparing for Life

Each night in King County, almost 1,100 unaccompanied youth and young adults experience homelessness on any given night, and around 70% of these youth sleep outside because of lack of shelter or housing. Why? A national study found that over 90% of homeless youth reported family conflict, 1/3 identified as LGBTQ+, and 1/4 suffered from abuse and neglect before they reached the streets. YouthCare builds confidence and self-sufficiency for homeless youth by providing a continuum of care that includes outreach, basic services, emergency shelter, housing, counseling, education, and employment training. Lend a hand by donating most needed items, delivering a warm mealhosting a virtual fundraiser, or hiring a YouthCare graduate.

http://youthcare.org/
(206) 694-4500
2500 NE 54th Street, Seattle


Northwest Harvest

Northwest Harvest’s mission is to end hunger in Washington. They partner with 375 food pantries, meal programs, and high-need schools across the state to provide nutritious food (an average of 2 million meals per month!) and promote good health for those in need. You can help by hosting a virtual food drive, making a cash donation, or volunteering (children age 9 and up can volunteer with you!).

http://www.northwestharvest.org/
1 (800) 722-6924
SODO Community Market Food Bank: 1915 4th Ave S, Seattle
Kent Warehouse: 22220 68th Ave S, Kent


http://www.marysplaceseattle.org/

Mary’s Place helps homeless women, children and families from the greater King County area. You can help by participating in their giving tree tag program now through December 11th. You can also volunteer your time, donate wishlist items, or share your used clothing, blankets, and coats.

http://www.marysplaceseattle.org
(206) 621-8474
Donation Center in SODO: 9 South Nevada St, Seattle
Mary’s Place at the Regrade: 720 Blanchard St, Seattle


Hopelink

Hopelink provides critical services to homeless and low-income families, children, seniors, and people with disabilities on north and east King County. You can help by donating to their Greatest Needs Fund, volunteering at one of their centers, participating in their Turkey Trot 5k fundraiser (virtual this year), or making a cash donation to support their “Lend a Hoping Hand” holiday giving campaign.

https://www.hopelink.org/
(425) 869-6000
8990 154th Ave NE, Redmond


Treehouse


Did you know less than 50% of Washington state youth in foster care graduate from high school? Treehouse seeks to level the playing field by providing academic and other essential support foster kids need to graduate at the same rate as their peers, with a plan for their future. You can help by hosting a holiday drive, purchasing items on their holiday wish list, volunteering, or donating.

https://www.treehouseforkids.org/
(206) 767-7000
2100 24th Avenue S./Suite 200


With a mission to help people in need of immediate food assistance, the Emergency Feeding Program partners with 120 local agencies to distribute 42,000 meals of quality, nutritious food per week and ensure that no one will go hungry tonight.  Your volunteer time or cash contribution would be most appreciated.

https://www.emergencyfeeding.org/
(425) 277-0300
851 Houser Way N, Suite A, Renton


Eastside Baby Corner was founded by a local pediatric nurse concerned about the large numbers of babies in her practice who began life without basic essentials like adequate food, clothing, beds, or safety equipment.  Today, Eastside Baby Corner’s locations in Issaquah, Northshore and Bremerton collect, purchase, and distribute essential care items such as formula, diapers, car seats, warm coats, school supplies, and more for babies and children in need. You can help out by donating goods or cash, shopping off their wish list, volunteering or organizing a drive.

Eastside Baby Corner:
http://babycorner.org

(425) 865-0234
1510 NW Maple St, Issaquah


Toys for Tots

Last year, King County Toys for Tots donated 85,169 toys to 61,092 local children in need. Consider helping out this year by making a cash donation, donating a toy before December 15th, hosting a Toys for Tots event, or asking your organization to become a toy drop site.

https://fort-lewis-wa.toysfortots.org
Coordinator: GySgt Edward Chapman, 760-405-3203


Food Lifeline

Every year, nearly 40% of our country’s food ends up in landfills, while millions go hungry. Food Lifeline attempts to solve both problems by rescuing millions of pounds of surplus food from farmers, manufacturers, grocery stores, and restaurants. They then deliver this healthy and nutritious food to more than 350 food banks, shelters and meal programs across Western Washington–providing the equivalent of 201,000+ meals every day for hungry children, adults and seniors. You can help by volunteering (opportunities are available for kids as young as 10, too!), donating funds or hosting a food drive.

https://foodlifeline.org/
(206) 545-6600
815 S 96th St, Seattle


Wellspring

Wellspring helps low-income and vulnerable individuals, children and families in Seattle and King County address issues such as mental health, family homelessness, early learning, basic needs, and domestic violence intervention. Each year they help thousands of children and families break cycles of instability, homelessness, and adversity to achieve positive, permanent change. You can help by donating essential items, cash, or your old vehicle. You can also get your kids involved in the Kids Helping Kids youth philanthropy program.

http://wellspringfs.org/
(206) 826-3050
1900 Rainier Avenue South, Seattle


Seattle Children's Hospital Research Foundation


Founded and run by a group of philanthropic women over 100 years ago, Seattle Children’s mission is to provide hope, care and cures to help every child live the healthiest and most fulfilling life possible. You can help their patients by donating a new toy or gift card, volunteering, contributing funds, or supporting one of its guilds (such as the Project Kids Cancer Cure Guild).

http://www.seattlechildrens.org
(206) 987-2000
4800 Sand Point Way NE, Seattle


Mercer island blog, windermere mercer island, windermere real estate, seattle blog, live on mercer, live on guides, community information, neighborhood information, real estate, mercer island community, mercer island community blog, mercer island blogger, mi reporter, mercer island real estate info,

Find a Home | Sell Your Home | Property Research

Neighborhoods | Market Reports | Our Team

We earn the trust and loyalty of our brokers and clients by doing real estate exceptionally well. The leader in our market, we deliver client-focused service in an authentic, collaborative, and transparent manner and with the unmatched knowledge and expertise that comes from decades of experience.

2737 77th Ave SE, Mercer Island, WA 98040 | (206) 232-0446
mercerisland@windermere.com

© Copyright 2021, Windermere Real Estate/Mercer Island.

Market Reports October 18, 2021

How’s the Market? Q3 Real Estate Review

The frenetic pace of Seattle-area real estate continued in Q3, with the number of sales and median sales prices both up across the region compared to this time last year. Seattle condo sales saw a healthy year-over-year jump as they continued to recover from the COVID slump we saw in 2020.


While buyers still contended with a lack of inventory and stiff competition for available homes, our continued low interest rates were the silver lining. Those obtaining financing were buoyed up by lower mortgage payments and increased buying power compared to times when rates are higher.


Click or scroll down to find your area report:

Seattle  |  Eastside  |  Mercer Island  |  Condos  |  Waterfront


SEATTLE

Seattle’s Median Sale Price increased by 8% to $865,500 (up from $800,000 in Q3 2020). Neighborhoods in Lake Forest Park-Kenmore (+19%), Shoreline (+13%), North Seattle (+10%), West Seattle (+10%), and Queen Anne-Magnolia (+9%) outperformed the average while South Seattle (+8%) stayed on par and Ballard-Green Lake (+5%) and Central Seattle (+2%) lagged behind.


There was an 8% increase in the number of Seattle homes sold in the third quarter of 2021 (3171) compared to Q3 2020 (2929) despite the tight supply of homes for sale. Central Seattle (+20%) and North Seattle (+18%) had the largest increases over Q3 2020 in number of homes sold.


79% of all Seattle homes, and 28% of those priced above $1 million, sold at or above the list price. The average of all homes sold closed at a price 4% more than list. Price increases were even more dramatic when homes sold in their first ten days on the market—with an average sale price of 7% above list price. The most competitive neighborhoods were North Seattle and South Seattle, with first 10-day sales averaging 9% and 8% above list price, respectively.


Seattle Recap

Click here for the full report and neighborhood-by-neighborhood statistics!

Seattle Report


↑ Back to top


EASTSIDE

The Eastside’s Median Sale Price was $1,325,500 in the third quarter of 2021, up 29% over Q3 2020 ($1,025,100). Buyer demand outpacing the supply of homes for sale was the biggest factor fueling this increase. Mercer Island, (+42%), Redmond (+32%), Sammamish (+32%), and South Eastside (+32%) saw the largest gains, while Woodinville (+23%) had the smallest year-over-year increase.


87% of all Eastside homes, and 65% of homes priced above one million dollars, sold for at or above their list price. With 59% fewer homes for sale than in Q3 2020, the entire Eastside market remained ultra-competitive. The average of all homes sold was 7% above list price. Homes sold within the first ten days went for an average of 11% above list price. The most competitive neighborhoods were East Bellevue and South Eastside, with first 10-day sales averaging 13% and 12% above list price, respectively.


The Eastside market saw Months of Inventory (the number of months it would take to sell all homes currently for sale) remain at historical lows of between 0.3 and 0.4 months. Many Eastside communities have had only a handful of homes for sale at any one time.


Eastside Recap

Click here for the full report and neighborhood-by-neighborhood statistics!

Eastside Report


↑ Back to top


MERCER ISLAND

Fewer than two dozen homes for sale on the Island at any given time has led to a continued ultra-competitive market and unpredictable shifts in median sale price as a result. It’s worth noting that a few very high-end waterfront home sales skewed the median sale price upward as compared to last year.


In the third quarter of 2021, 75% of all homes sold at or above their listed price. Sellers who prepped and priced their homes competitively reaped huge rewards from bidding wars—those that sold in the first 10 days on market closed for an average of 10% above their list price.


On the other hand, those properties that were not immediately snapped up tended to sell at a discount. Homes on the market 11-30 days sold for an average of 3% below their list price, while homes on the market longer than 30 days sold for an average of 5% below their list price. Pricing and condition tended to separate the “haves” from the “have nots” when it came to selling quickly.


Mercer Island Recap

Click here for the full report and neighborhood-by-neighborhood statistics!

Mercer Island Report

↑ Back to top


CONDOS – SEATTLE & EASTSIDE

Condos did quite well overall in the third quarter of 2021 as single-family home markets became more competitive, and in some cases, unattainable.


Seattle condos saw a 3% increase (to $492,750) and Eastside condos saw a 10% increase (to $551,619) in Median Sale Price compared to Q3 2020.


62% of Seattle condos and 78% of Eastside condos sold at or above their listed price. Those sold in the first 10 days on the market went for an average of 2% and 5% above their list price, respectively.


Check out area-by-area details the full condo report.


Condo Report

↑ Back to top


WATERFRONT

The waterfront home market continues to see incredible buyer demand while also suffering from an extreme shortage of available homes for sale. Nearly every waterfront home listed for sale sold in record time, some for jaw-dropping prices. The Eastside had 23 waterfront home sales in the third quarter of 2021 while Seattle had 22 Q3 waterfront sales, Mercer Island had 15, and Lake Sammamish had 10 waterfront sales. More than half of waterfront homes listed for sale went under contract in mere days, with an average market time still a fraction of that of a more typical year.


As an indicator of demand in the luxury segment, with few outliers, most homes sold near to or above their list price—something that historically has rarely happened in this sector.


This brief overview of the entire Seattle-Eastside private waterfront market, including Mercer Island and Lake Sammamish, illustrates the trends occurring in our region over time. This data is interesting and insightful but cannot replace an in-depth waterfront analysis provided by a savvy broker with years of local waterfront experience.


Waterfront Report

↑ Back to top


Mercer island blog, windermere mercer island, windermere real estate, seattle blog, live on mercer, live on guides, community information, neighborhood information, real estate, mercer island community, mercer island community blog, mercer island blogger, mi reporter, mercer island real estate info,

Find a Home | Sell Your Home | Property Research

Neighborhoods | Market Reports | Our Team

We earn the trust and loyalty of our brokers and clients by doing real estate exceptionally well. The leader in our market, we deliver client-focused service in an authentic, collaborative, and transparent manner and with the unmatched knowledge and expertise that comes from decades of experience.

2737 77th Ave SE, Mercer Island, WA 98040 | (206) 232-0446
mercerisland@windermere.com

© Copyright 2021, Windermere Real Estate/Mercer Island. Information and statistics derived from Northwest Multiple Listing Service and deemed accurate but not guaranteed.

Market Reports July 8, 2021

How’s the Market? Q2 Real Estate Review

Buyers found no relief as our region’s extreme sellers’ market continued skyward. Strong home buyer demand simply outpaced the number of available properties for sale. Fierce competition drove prices up 15% in Seattle and a staggering 38% on the Eastside as compared to Q2 of 2020. While COVID played a factor in early 2020; all things considered, prices have increased substantially in the first half of 2021.


Home affordability, or unaffordability, is one of the most significant factors impacting our communities. Many first-time buyers, retirees, and moderate wage earners are finding the tri-county region of King, Snohomish, and Pierce Counties simply out of reach…or find themselves settling for accommodations that are far less than expected. The Seattle area, much like other high-priced markets across the country, has become a region where only the affluent can afford to own real estate.


As we move into the summer, buyer fatigue, coupled with COVID reopening of recreation and vacation opportunities, may provide much needed dampening of buyer demand. Our market desperately needs more balance between buyers and sellers in the market.


Click or scroll down to find your area report:

Seattle  |  Eastside  |  Mercer Island  |  Condos  |  Waterfront


SEATTLE

Seattle’s Median Sale Price increased by 15% to $895,000 (up from $780,000 in Q2 2020). North end neighborhoods in Shoreline (+37%), Lake Forest Park-Kenmore (+37%), and North Seattle (+18%) outperformed the average while South Seattle (+9%), West Seattle (+11%). and Central Seattle (+12%) lagged slightly behind.


There was a 74% increase in the number of Seattle homes sold in Q2 (3,404) compared to Q2 2020 (1,956)—much of which can be attributed to COVID-related factors. Central Seattle (+116%) and West Seattle (+90%) had the largest increases in number of homes sold.


86% of all Seattle homes, and 33% of those priced above $1 million, sold at or above list, with the average of all homes sold at prices 6% more than list. Price increases were even more dramatic when homes sold in their first ten days on the market (76% of all listings) with an average sale price of 10% above list price. The most competitive neighborhoods were Kenmore-Lake Forest Park and North Seattle, with first 10-day sales averaging 15% and 13% above list price, respectively.


Seattle Recap

Click here for the full report and neighborhood-by-neighborhood statistics!

Seattle Report


↑ Back to top


EASTSIDE

The Eastside’s Median Sale Price was $1,320,355 in Q2, up 38% over Q2 2020 ($958,000). Buyer demand outpacing the supply of homes for sale was the biggest factor fueling this increase. Redmond, (+48%), Kirkland (+48%), and South Eastside (+45%) saw the largest gains, while West Bellevue (+7%) had the smallest year-over-year increase.


93% of all Eastside homes, and 68% of homes priced above one million dollars, sold for at or above their list price. With 70% fewer homes for sale than in Q2 2020, the entire Eastside market remained ultra-competitive. The average of all homes sold was 9% above list price and homes sold within the first ten days went for an average of 13% above list price.


The Eastside market saw Months of Inventory (the number of months it would take to sell all homes currently for sale) remain at historical lows of between 0.3 and 0.4 months. Many Eastside communities have had only a handful of homes for sale at any one time.


Eastside Recap

Click here for the full report and neighborhood-by-neighborhood statistics!

Eastside Report


↑ Back to top


MERCER ISLAND

Fewer than two dozen homes for sale on the Island at any given time has led to a continued ultra-competitive market with 90% of all homes sold at or above their listed price. Those sold in the first 10 days on market (77% of all sales) closed for an average of 13% above their list price. Homes on the market 11-30 days sold for an average of 1% above list and homes on the market longer than 30 days sold for an average of 4% below their list price.


Mercer Island Recap

Click here for the full report and neighborhood-by-neighborhood statistics!

Mercer Island Report

↑ Back to top


CONDOS – SEATTLE & EASTSIDE

Condo demand surged in Q2 as single-family home markets became more competitive, and in some cases, unattainable.


Seattle condos saw a 7% increase (to $488,750) and Eastside condos saw a 5% increase (to $550,000) in Median Sale Price compared to Q2 2020. Fueled by new construction development, South Seattle saw a three-fold increase in the number of condos sold, while the number of West Bellevue condos sold was up nearly double.


61% of Seattle condos and 80% of Eastside condos sold at or above their listed price. Those that were sold in the first 10 days (48% of Seattle and 70% of Eastside sales) sold for an average of 2% and 5% above their list price, respectively.


Check out area-by-area details the full condo report.


Condo Report

↑ Back to top


WATERFRONT

Waterfront listings were swooped up by buyers nearly as quickly as they came to market, some for staggering margins. Lake Sammamish had a record 18 sales while the Eastside had 17, Seattle 14, and Mercer Island had 7. Many waterfront homes went under contract in mere days, with an average market time in the teens instead of months.


As an indicator of demand in the luxury segment, most homes sold above their list price—something that historically has rarely happened in this sector. Some of most competitive homes sold for outrageously more than their list price as affluent buyers opened their pocketbooks for the win.


This brief overview of the entire Seattle-Eastside private waterfront market, including Mercer Island and Lake Sammamish, illustrates the trends occurring in our region over time. This data is interesting and insightful, but can’t replace an in-depth waterfront analysis provided by a savvy broker with years of local waterfront experience.


↑ Back to top


Mercer island blog, windermere mercer island, windermere real estate, seattle blog, live on mercer, live on guides, community information, neighborhood information, real estate, mercer island community, mercer island community blog, mercer island blogger, mi reporter, mercer island real estate info,

Find a Home | Sell Your Home | Property Research

Neighborhoods | Market Reports | Our Team

We earn the trust and loyalty of our brokers and clients by doing real estate exceptionally well. The leader in our market, we deliver client-focused service in an authentic, collaborative, and transparent manner and with the unmatched knowledge and expertise that comes from decades of experience.

2737 77th Ave SE, Mercer Island, WA 98040 | (206) 232-0446
mercerisland@windermere.com

© Copyright 2021, Windermere Real Estate/Mercer Island. Information and statistics derived from Northwest Multiple Listing Service and deemed accurate but not guaranteed.

Living & Community May 6, 2021

Thank You for Helping Us Support Eastside Baby Corner!

UPDATE—Our Drive Made a Difference for EBC!

We want to thank all of our clients, friends and family who pitched in to raise items and funds for the Eastside Baby Corner. In addition to your generous donations, our agents and owners personally donated a total of $7,772 along with hundreds of childcare items as part of our annual Community Service Day effort. Together, we made a difference for local kids in need. Thank you!


For the past 30 years, Eastside Baby Corner has been there to help kids access the essentials they need to grow, play, learn and thrive. As part of our annual Community Service Day, our agents and owners are pitching in to support EBC with funds and the items they need most right now. You can help too! Support local children from birth through 12 years old (and expectant mothers) with a donation of diapers, diaper wipes, shampoo, conditioner, detangler, body wash, soap, toothbrushes, toothpaste, or funds to purchase those items.


IN PERSON DROP-OFF

Drop off new items at our office: 2737 77th Ave SE, Mercer Island 98040  Monday-Friday 8 am-5 pm

Plus, Saturday, May 22nd from 9 am-2pm during our annual paper shredding event (because why not get your old docs shredded for free while you’re doing something great for the community?!)


DONATE ONLINE

Contribute funds to allow Eastside Baby Corner staff to purchase the items most needed: Donate funds directly to Eastside Baby Corner


SHOP ONLINE

Choose items from EBC’s Wish List of needed items (ships directly to EBC)


PRINTABLE FLYER

View the PDF flyer with all the details


Windermere Community Service Day


We earn the trust and loyalty of our brokers and clients by doing real estate exceptionally well. The leader in our market, we deliver client-focused service in an authentic, collaborative and transparent manner and with the unmatched knowledge and expertise that comes from decades of experience.


Market Reports April 12, 2021

How’s the Market? Q1 Real Estate Review…

An extreme sellers’ market, driven by too few homes for sale and incredibly low mortgage interest rates, led to the most aggressive multiple offer bidding wars we have experienced in our region. There are simply dozens of buyers for nearly every home that comes to market. To be competitive, most buyers did their home research prior to writing an offer, waived typical protective contingencies—including financing, appraisal, title, and inspection—and drained their savings and investment accounts to pay cash or fund discrepancies between the purchase price and appraised value.


The ability to secure a suitable home in a neighborhood of choice is a luxury not afforded to many buyers, regardless of assets. Indeed, the lack of inventory for sale and competitiveness of the market has kept many current homeowners from moving to a home that would better suit their needs or commute.


Home affordability, or unaffordability, is at crisis levels. Most homes are completely unaffordable to first-time buyers and moderate wage earners who are finding it increasingly difficult to work and live within King County. Snohomish and Pierce Counties are not far behind. While cities and counties are coming to the table to address this issue, the potential solutions will take years to implement and see relief.


Time will tell if For Sale inventory levels will increase as we move further into our peak spring season market.


Click or scroll down to find your area report:

Seattle  |  Eastside  |  Mercer Island  |  Condos  |  Waterfront


SEATTLE

Seattle’s Median Sale Price increased by 7% to $800,000 (up from $750,000 a year ago in Q1 2020). Shoreline (+11%), Lake Forest Park-Kenmore (+11%), and South Seattle (+9%) outperformed the average while West Seattle (-2%) and Queen Anne-Magnolia (+4%) lagged.


There was a 39% increase in the number of Seattle homes sold in Q1 (2,271) compared to Q1 2020 (1,632)—much of which can be attributed to emerging COVID concerns in 2020 coupled with increased mobility in 2021. Queen Anne-Magnolia (+91%), West Seattle (+51%), and North Seattle (+47%) had the largest increases in number of homes sold, although all neighborhoods except Lake Forest Park-Kenmore saw double-digit increases in total sales.


75% of all Seattle homes, and 19% of those priced above $1 million, sold at or above their listed price. The most competitive Seattle markets were Kenmore-Lake Forest Park and North Seattle, with sales in the first 10 days averaging 111% and 110% of their listed price, compared to the 107% average for all Seattle neighborhoods combined.


Seattle Recap

Click here for the full report and neighborhood-by-neighborhood statistics!

Seattle Report


↑ Back to top


EASTSIDE

The Eastside’s Median Sale Price was $1,300,000 in Q1, up 31% over Q1 2020 ($989,950). Movement of companies and households to the Eastside and the extreme lack of a supply of homes for sale were the biggest contributors to this increase. South of I-90 (+39%) saw the largest gains, while the higher-priced markets of Kirkland (+16%), Mercer Island (+17%), and West Bellevue (+22%) had the smallest year-over-year increases—although being well into the double-digits, they could hardly be considered small.


85% of all Eastside homes, and 59% of homes priced above one million dollars, sold for at or above their list price. With 71% fewer homes for sale than in Q1 2020, the entire Eastside market remained ultra-competitive. East Bellevue sales topped the charts with an average sale price of 112% above list price for sales occurring in the first 10 days on the market.


The Eastside market saw Months of Inventory (the number of months it would take to sell all homes currently for sale) remain at historical lows of between .3 and .6 months. Despite the limited supply of homes for sale, there was a 25% increase in the number of Eastside homes sold in Q1 (1,413) compared to Q1 2020 (1,133)—much of which can be attributed to emerging COVID concerns in 2020 and in-migration to the Eastside.


Eastside Recap

Click here for the full report and neighborhood-by-neighborhood statistics!

Eastside Report


↑ Back to top


MERCER ISLAND

Most notable on the Island was the continued lack of affordable housing options with no sales below $1 million, and only 10 sales below $1.5 million, in Q1. High end sales dominated the market with 30 of the Island’s 64 sales of homes priced $2 million and above. Mercer Island waterfront listings remained depleted with an average of 2 waterfront homes for sale at any given time and a mere 3 sales in all of Q1.


Q1 saw an average of only 17 homes available for sale—an unbelievable low for a typically burgeoning Q1 on the Island. This has led to a continued ultra-competitive market for the most desirable homes, especially those offering one-level living, a main floor owner’s suite or prime waterfront.


A staggering 81% of all homes sold at or above their listed price and those that sold in the first 10 days (75% of all sales) closed for an average of 110% of their listed price. That increase equated to sellers receiving an average of nearly $200,000 above their listed price at Island’s median sale price.


Mercer Island Recap

Click here for the full report and neighborhood-by-neighborhood statistics!

Mercer Island Report

↑ Back to top


CONDOS – SEATTLE & EASTSIDE

Condos have remained an attractive and more affordable option for entry-level buyers who might otherwise rent. As single-family home markets become more competitive, condo ownership becomes a more compelling—and many times the only—option for those wishing to begin their homeownership journey.


While the number of single-family homes for sale has been on the decline regionally, Seattle condos experienced a 45% increase in the number of units for sale while Eastside condos saw 23% fewer units for sale compared to Q1 2020. Both Seattle (+18%) and the Eastside (+30%) saw an increase in the number of Q1 sales.


Seattle condos saw a 3% increase (to $476,000) and Eastside condos saw a 9% increase (to $535,000) in Median Sale Price compared to Q1 2020. Fueled by new construction townhome development, South Seattle posted a 56% increase in its Median Sale Price during that same period. On the Eastside, with townhomes providing a solid alternative to lacking single-family homes, Sammamish was a standout with a 16% increase over Q1 2020


51% of Seattle condos and 70% of Eastside condos sold at or above their listed price. Those that were sold in the first 10 days (35% of Seattle and 55% of Eastside sales) sold for an average of 103% of their listed price.


Check out area-by-area details the full condo report.


Condo Report

↑ Back to top


WATERFRONT

With a meager combined average of only 7 homes for sale (compared to 26 in Q1 2020) Mercer Island and Eastside waterfront headlines could only read that there was nearly nothing available for sale in Q1. The Seattle market was just above typical inventory levels (with an average of 12 homes for sale compared to 10 in Q1 2020) while Lake Sammamish maintained its two-year running low of 5 homes for sale.


While many waterfront homes went under contract in mere days, they did not see the dramatic price escalations in Q1 that the more affordable, non-waterfront market has experienced. In fact, only one sale closed at (a fraction of 1%) above its listed price. While 4 of the 14 Q1 sales closed at 100% of their listed price, a fair amount of price negotiation was far more common.


This top-level overview of the entire Seattle-Eastside private waterfront market, including Mercer Island and Lake Sammamish, provides a glance into the trends occurring in our region over time. It is interesting, and insightful, but in no way replaces an in-depth analysis on waterfront value provided by a savvy broker with years of local waterfront experience.


↑ Back to top


We earn the trust and loyalty of our brokers and clients by doing real estate exceptionally well. The leader in our market, we deliver client-focused service in an authentic, collaborative and transparent manner and with the unmatched knowledge and expertise that comes from decades of experience.

© Copyright 2021, Windermere Real Estate/Mercer Island. Information and statistics derived from Northwest Multiple Listing Service and deemed accurate but not guaranteed.

Home Seller Tips December 18, 2020

The Downside of Selling Your Home Off Market

Who wouldn’t want the enticement of a full price offer on their home before it even comes to market? At first glance it seems like a compelling opportunity, but it comes at a steep price.

With the shortage of homes today, friends and neighbors are all on the lookout for up-and-coming listings. They aren’t hard to spot amongst the buzz of spruce up activity that often occurs as a home is being prepped for the market. Often the buyer or their broker contact the seller or their broker to request an early showing and you can guess what transpires from there. You and your broker have a list price in mind and the buyer’s offer comes in at that price. What could be better?

Are you leaving money on the table?

For starters, consider that homes in the Seattle-Eastside region are typically selling well above their asking prices. Local market data shows most homes bring in 3-8% above their listed prices during the last several months. This occurs when multiple buyers are competing for the same property…something that doesn’t happen when negotiating off market with a single buyer. Consider a home at Seattle’s median price of $800,000, 3-8% equates to $24,000-$64,000 left on the table.

But that isn’t all there is to consider. In our current highly competitive market, it isn’t unusual for buyers to waive contingencies such as financing and appraisal, pre-inspect or waive the inspection contingency, and often even release their earnest money as non-refundable. This does not often happen in a non-competing situation and leaves you vulnerable to transaction challenges before closing.

In addition, it is often the buyers who can’t effectively compete in an open market that are most motivated to try to get you to sell off market. This benefits the buyer significantly, but eliminates the benefits to you of a strong seller-favored market.


What about iBuyer company offers?

iBuyers are companies that agree to pay a set amount for your home up front and then list it for sale after you move out. They have gained popularity in some markets-Phoenix and Atlanta especially. In 2019, they had 59,000 transactions nationwide or about half of one percent market share of the 5.38 million transactions last year. Amidst COVID and economic concerns, iBuyer market share was down dramatically in 2020 and remains uncertain for 2021.

Nationally, their sweet spot has been predictable subdivision homes priced around $250,000. They have traditionally avoided higher priced markets due to the added risk in pricing. And they have historically avoided Washington State because of our real property transfer tax that adds ~2% to the cost of sale.

While selling to an iBuyer might seem easy and intriguing, it helps to remember these companies are in business to make a profit at your expense. iBuyers charge a 6-10% service fee in addition to factoring in the cost of needed repairs or updates (data shows an average of 2-5% of the sale price). Atypical expenses, like our state’s 2% transfer tax, are also calculated into the net. Add it all up and it is a hefty price to pay for the convenience of not having to go through the sale process.

On other thing to note is that iBuyers also profit by selling the names of homeowners who contact them for a bid, but do not accept that bid (93-98% of inquiries, depending on the company), to real estate agents without an established client base who are willing to pay for leads. These are typically not the most successful real estate brokers in a given marketplace. Not only do sellers who use these brokers often lose out on the benefits of working with a knowledgeable and established Realtor, that broker’s marketing budget is consumed largely by paying for leads instead of prominently marketing your home.


Final thoughts

It’s so easy to get caught up in the whirlwind of an off-market offer. And it’s flattering to feel like your home is so appealing that people are knocking on your door before it even debuts. For some, the privacy of an off-market sale offsets the considerable dollars left on the table. But for most of us, those dollars matter. And having multiple interested buyers instead of just one means better terms and more certainty as you head towards the closing table.

Still have questions? Contact one of our knowledgeable brokers for assistance with how to purchase, sell, or determine the value of any property you are considering.


Find a Home | Sell Your Home | Property Research | Neighborhoods | Market Reports | Our Team

We earn the trust and loyalty of our brokers and clients by doing real estate exceptionally well. The leader in our market, we deliver client-focused service in an authentic, collaborative and transparent manner and with the unmatched knowledge and expertise that comes from decades of experience.

© Copyright 2020 Windermere Mercer Island.