 Facebook
 Twitter
 Pinterest
 Copy Link
How’s the Market? Q3 Real Estate Review

The frenetic pace of Seattle-area real estate continued in Q3, with the number of sales and median sales prices both up across the region compared to this time last year. Seattle condo sales saw a healthy year-over-year jump as they continued to recover from the COVID slump we saw in 2020.
While buyers still contended with a lack of inventory and stiff competition for available homes, our continued low interest rates were the silver lining. Those obtaining financing were buoyed up by lower mortgage payments and increased buying power compared to times when rates are higher.
Click or scroll down to find your area report:
Seattle | Eastside | Mercer Island | Condos | Waterfront
SEATTLE
Seattle’s Median Sale Price increased by 8% to $865,500 (up from $800,000 in Q3 2020). Neighborhoods in Lake Forest Park-Kenmore (+19%), Shoreline (+13%), North Seattle (+10%), West Seattle (+10%), and Queen Anne-Magnolia (+9%) outperformed the average while South Seattle (+8%) stayed on par and Ballard-Green Lake (+5%) and Central Seattle (+2%) lagged behind.
There was an 8% increase in the number of Seattle homes sold in the third quarter of 2021 (3171) compared to Q3 2020 (2929) despite the tight supply of homes for sale. Central Seattle (+20%) and North Seattle (+18%) had the largest increases over Q3 2020 in number of homes sold.
79% of all Seattle homes, and 28% of those priced above $1 million, sold at or above the list price. The average of all homes sold closed at a price 4% more than list. Price increases were even more dramatic when homes sold in their first ten days on the market—with an average sale price of 7% above list price. The most competitive neighborhoods were North Seattle and South Seattle, with first 10-day sales averaging 9% and 8% above list price, respectively.

Click here for the full report and neighborhood-by-neighborhood statistics!

EASTSIDE
The Eastside’s Median Sale Price was $1,325,500 in the third quarter of 2021, up 29% over Q3 2020 ($1,025,100). Buyer demand outpacing the supply of homes for sale was the biggest factor fueling this increase. Mercer Island, (+42%), Redmond (+32%), Sammamish (+32%), and South Eastside (+32%) saw the largest gains, while Woodinville (+23%) had the smallest year-over-year increase.
87% of all Eastside homes, and 65% of homes priced above one million dollars, sold for at or above their list price. With 59% fewer homes for sale than in Q3 2020, the entire Eastside market remained ultra-competitive. The average of all homes sold was 7% above list price. Homes sold within the first ten days went for an average of 11% above list price. The most competitive neighborhoods were East Bellevue and South Eastside, with first 10-day sales averaging 13% and 12% above list price, respectively.
The Eastside market saw Months of Inventory (the number of months it would take to sell all homes currently for sale) remain at historical lows of between 0.3 and 0.4 months. Many Eastside communities have had only a handful of homes for sale at any one time.

Click here for the full report and neighborhood-by-neighborhood statistics!

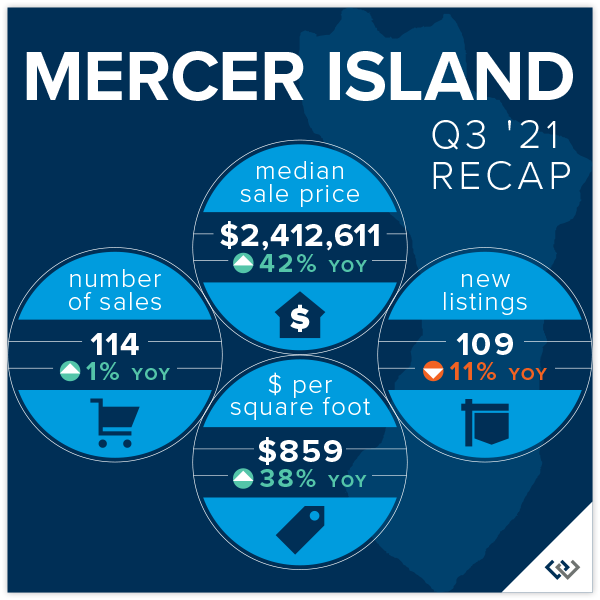
MERCER ISLAND
Fewer than two dozen homes for sale on the Island at any given time has led to a continued ultra-competitive market and unpredictable shifts in median sale price as a result. It’s worth noting that a few very high-end waterfront home sales skewed the median sale price upward as compared to last year.
In the third quarter of 2021, 75% of all homes sold at or above their listed price. Sellers who prepped and priced their homes competitively reaped huge rewards from bidding wars—those that sold in the first 10 days on market closed for an average of 10% above their list price.
On the other hand, those properties that were not immediately snapped up tended to sell at a discount. Homes on the market 11-30 days sold for an average of 3% below their list price, while homes on the market longer than 30 days sold for an average of 5% below their list price. Pricing and condition tended to separate the “haves” from the “have nots” when it came to selling quickly.
Click here for the full report and neighborhood-by-neighborhood statistics!

CONDOS – SEATTLE & EASTSIDE
Condos did quite well overall in the third quarter of 2021 as single-family home markets became more competitive, and in some cases, unattainable.
Seattle condos saw a 3% increase (to $492,750) and Eastside condos saw a 10% increase (to $551,619) in Median Sale Price compared to Q3 2020.
62% of Seattle condos and 78% of Eastside condos sold at or above their listed price. Those sold in the first 10 days on the market went for an average of 2% and 5% above their list price, respectively.
Check out area-by-area details the full condo report.

WATERFRONT
The waterfront home market continues to see incredible buyer demand while also suffering from an extreme shortage of available homes for sale. Nearly every waterfront home listed for sale sold in record time, some for jaw-dropping prices. The Eastside had 23 waterfront home sales in the third quarter of 2021 while Seattle had 22 Q3 waterfront sales, Mercer Island had 15, and Lake Sammamish had 10 waterfront sales. More than half of waterfront homes listed for sale went under contract in mere days, with an average market time still a fraction of that of a more typical year.
As an indicator of demand in the luxury segment, with few outliers, most homes sold near to or above their list price—something that historically has rarely happened in this sector.
This brief overview of the entire Seattle-Eastside private waterfront market, including Mercer Island and Lake Sammamish, illustrates the trends occurring in our region over time. This data is interesting and insightful but cannot replace an in-depth waterfront analysis provided by a savvy broker with years of local waterfront experience.


Find a Home | Sell Your Home | Property Research
Neighborhoods | Market Reports | Our Team
We earn the trust and loyalty of our brokers and clients by doing real estate exceptionally well. The leader in our market, we deliver client-focused service in an authentic, collaborative, and transparent manner and with the unmatched knowledge and expertise that comes from decades of experience.
2737 77th Ave SE, Mercer Island, WA 98040 | (206) 232-0446
mercerisland@windermere.com
© Copyright 2021, Windermere Real Estate/Mercer Island. Information and statistics derived from Northwest Multiple Listing Service and deemed accurate but not guaranteed.
How’s the Market? Q2 Real Estate Review

Buyers found no relief as our region’s extreme sellers’ market continued skyward. Strong home buyer demand simply outpaced the number of available properties for sale. Fierce competition drove prices up 15% in Seattle and a staggering 38% on the Eastside as compared to Q2 of 2020. While COVID played a factor in early 2020; all things considered, prices have increased substantially in the first half of 2021.
Home affordability, or unaffordability, is one of the most significant factors impacting our communities. Many first-time buyers, retirees, and moderate wage earners are finding the tri-county region of King, Snohomish, and Pierce Counties simply out of reach…or find themselves settling for accommodations that are far less than expected. The Seattle area, much like other high-priced markets across the country, has become a region where only the affluent can afford to own real estate.
As we move into the summer, buyer fatigue, coupled with COVID reopening of recreation and vacation opportunities, may provide much needed dampening of buyer demand. Our market desperately needs more balance between buyers and sellers in the market.
Click or scroll down to find your area report:
Seattle | Eastside | Mercer Island | Condos | Waterfront
SEATTLE
Seattle’s Median Sale Price increased by 15% to $895,000 (up from $780,000 in Q2 2020). North end neighborhoods in Shoreline (+37%), Lake Forest Park-Kenmore (+37%), and North Seattle (+18%) outperformed the average while South Seattle (+9%), West Seattle (+11%). and Central Seattle (+12%) lagged slightly behind.
There was a 74% increase in the number of Seattle homes sold in Q2 (3,404) compared to Q2 2020 (1,956)—much of which can be attributed to COVID-related factors. Central Seattle (+116%) and West Seattle (+90%) had the largest increases in number of homes sold.
86% of all Seattle homes, and 33% of those priced above $1 million, sold at or above list, with the average of all homes sold at prices 6% more than list. Price increases were even more dramatic when homes sold in their first ten days on the market (76% of all listings) with an average sale price of 10% above list price. The most competitive neighborhoods were Kenmore-Lake Forest Park and North Seattle, with first 10-day sales averaging 15% and 13% above list price, respectively.

Click here for the full report and neighborhood-by-neighborhood statistics!

EASTSIDE
The Eastside’s Median Sale Price was $1,320,355 in Q2, up 38% over Q2 2020 ($958,000). Buyer demand outpacing the supply of homes for sale was the biggest factor fueling this increase. Redmond, (+48%), Kirkland (+48%), and South Eastside (+45%) saw the largest gains, while West Bellevue (+7%) had the smallest year-over-year increase.
93% of all Eastside homes, and 68% of homes priced above one million dollars, sold for at or above their list price. With 70% fewer homes for sale than in Q2 2020, the entire Eastside market remained ultra-competitive. The average of all homes sold was 9% above list price and homes sold within the first ten days went for an average of 13% above list price.
The Eastside market saw Months of Inventory (the number of months it would take to sell all homes currently for sale) remain at historical lows of between 0.3 and 0.4 months. Many Eastside communities have had only a handful of homes for sale at any one time.

Click here for the full report and neighborhood-by-neighborhood statistics!

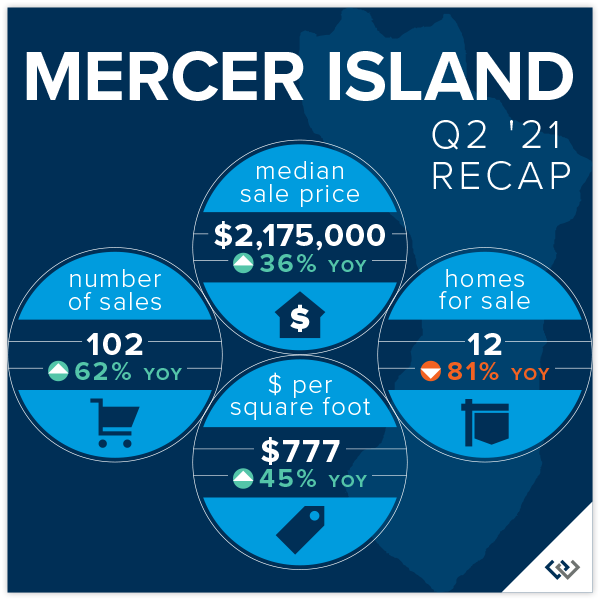
MERCER ISLAND
Fewer than two dozen homes for sale on the Island at any given time has led to a continued ultra-competitive market with 90% of all homes sold at or above their listed price. Those sold in the first 10 days on market (77% of all sales) closed for an average of 13% above their list price. Homes on the market 11-30 days sold for an average of 1% above list and homes on the market longer than 30 days sold for an average of 4% below their list price.
Click here for the full report and neighborhood-by-neighborhood statistics!

CONDOS – SEATTLE & EASTSIDE
Condo demand surged in Q2 as single-family home markets became more competitive, and in some cases, unattainable.
Seattle condos saw a 7% increase (to $488,750) and Eastside condos saw a 5% increase (to $550,000) in Median Sale Price compared to Q2 2020. Fueled by new construction development, South Seattle saw a three-fold increase in the number of condos sold, while the number of West Bellevue condos sold was up nearly double.
61% of Seattle condos and 80% of Eastside condos sold at or above their listed price. Those that were sold in the first 10 days (48% of Seattle and 70% of Eastside sales) sold for an average of 2% and 5% above their list price, respectively.
Check out area-by-area details the full condo report.

WATERFRONT
Waterfront listings were swooped up by buyers nearly as quickly as they came to market, some for staggering margins. Lake Sammamish had a record 18 sales while the Eastside had 17, Seattle 14, and Mercer Island had 7. Many waterfront homes went under contract in mere days, with an average market time in the teens instead of months.
As an indicator of demand in the luxury segment, most homes sold above their list price—something that historically has rarely happened in this sector. Some of most competitive homes sold for outrageously more than their list price as affluent buyers opened their pocketbooks for the win.
This brief overview of the entire Seattle-Eastside private waterfront market, including Mercer Island and Lake Sammamish, illustrates the trends occurring in our region over time. This data is interesting and insightful, but can’t replace an in-depth waterfront analysis provided by a savvy broker with years of local waterfront experience.

Find a Home | Sell Your Home | Property Research
Neighborhoods | Market Reports | Our Team
We earn the trust and loyalty of our brokers and clients by doing real estate exceptionally well. The leader in our market, we deliver client-focused service in an authentic, collaborative, and transparent manner and with the unmatched knowledge and expertise that comes from decades of experience.
2737 77th Ave SE, Mercer Island, WA 98040 | (206) 232-0446
mercerisland@windermere.com
© Copyright 2021, Windermere Real Estate/Mercer Island. Information and statistics derived from Northwest Multiple Listing Service and deemed accurate but not guaranteed.
How’s the Market? Q1 Real Estate Review…

An extreme sellers’ market, driven by too few homes for sale and incredibly low mortgage interest rates, led to the most aggressive multiple offer bidding wars we have experienced in our region. There are simply dozens of buyers for nearly every home that comes to market. To be competitive, most buyers did their home research prior to writing an offer, waived typical protective contingencies—including financing, appraisal, title, and inspection—and drained their savings and investment accounts to pay cash or fund discrepancies between the purchase price and appraised value.
The ability to secure a suitable home in a neighborhood of choice is a luxury not afforded to many buyers, regardless of assets. Indeed, the lack of inventory for sale and competitiveness of the market has kept many current homeowners from moving to a home that would better suit their needs or commute.
Home affordability, or unaffordability, is at crisis levels. Most homes are completely unaffordable to first-time buyers and moderate wage earners who are finding it increasingly difficult to work and live within King County. Snohomish and Pierce Counties are not far behind. While cities and counties are coming to the table to address this issue, the potential solutions will take years to implement and see relief.
Time will tell if For Sale inventory levels will increase as we move further into our peak spring season market.
Click or scroll down to find your area report:
Seattle | Eastside | Mercer Island | Condos | Waterfront
SEATTLE
Seattle’s Median Sale Price increased by 7% to $800,000 (up from $750,000 a year ago in Q1 2020). Shoreline (+11%), Lake Forest Park-Kenmore (+11%), and South Seattle (+9%) outperformed the average while West Seattle (-2%) and Queen Anne-Magnolia (+4%) lagged.
There was a 39% increase in the number of Seattle homes sold in Q1 (2,271) compared to Q1 2020 (1,632)—much of which can be attributed to emerging COVID concerns in 2020 coupled with increased mobility in 2021. Queen Anne-Magnolia (+91%), West Seattle (+51%), and North Seattle (+47%) had the largest increases in number of homes sold, although all neighborhoods except Lake Forest Park-Kenmore saw double-digit increases in total sales.
75% of all Seattle homes, and 19% of those priced above $1 million, sold at or above their listed price. The most competitive Seattle markets were Kenmore-Lake Forest Park and North Seattle, with sales in the first 10 days averaging 111% and 110% of their listed price, compared to the 107% average for all Seattle neighborhoods combined.

Click here for the full report and neighborhood-by-neighborhood statistics!

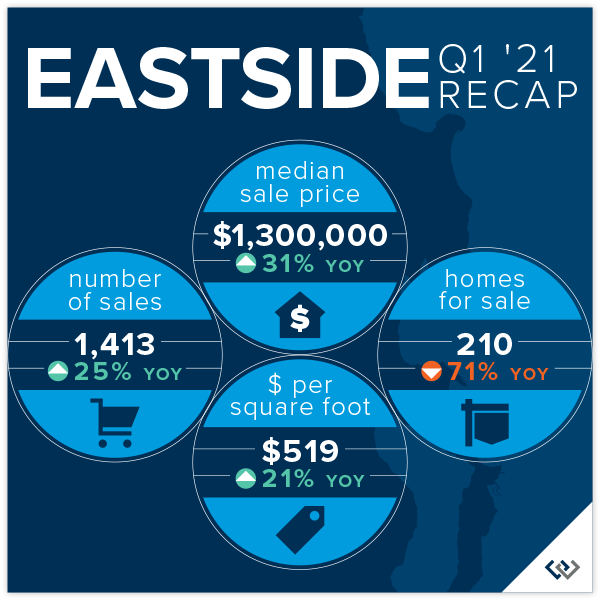
EASTSIDE
The Eastside’s Median Sale Price was $1,300,000 in Q1, up 31% over Q1 2020 ($989,950). Movement of companies and households to the Eastside and the extreme lack of a supply of homes for sale were the biggest contributors to this increase. South of I-90 (+39%) saw the largest gains, while the higher-priced markets of Kirkland (+16%), Mercer Island (+17%), and West Bellevue (+22%) had the smallest year-over-year increases—although being well into the double-digits, they could hardly be considered small.
85% of all Eastside homes, and 59% of homes priced above one million dollars, sold for at or above their list price. With 71% fewer homes for sale than in Q1 2020, the entire Eastside market remained ultra-competitive. East Bellevue sales topped the charts with an average sale price of 112% above list price for sales occurring in the first 10 days on the market.
The Eastside market saw Months of Inventory (the number of months it would take to sell all homes currently for sale) remain at historical lows of between .3 and .6 months. Despite the limited supply of homes for sale, there was a 25% increase in the number of Eastside homes sold in Q1 (1,413) compared to Q1 2020 (1,133)—much of which can be attributed to emerging COVID concerns in 2020 and in-migration to the Eastside.
Click here for the full report and neighborhood-by-neighborhood statistics!

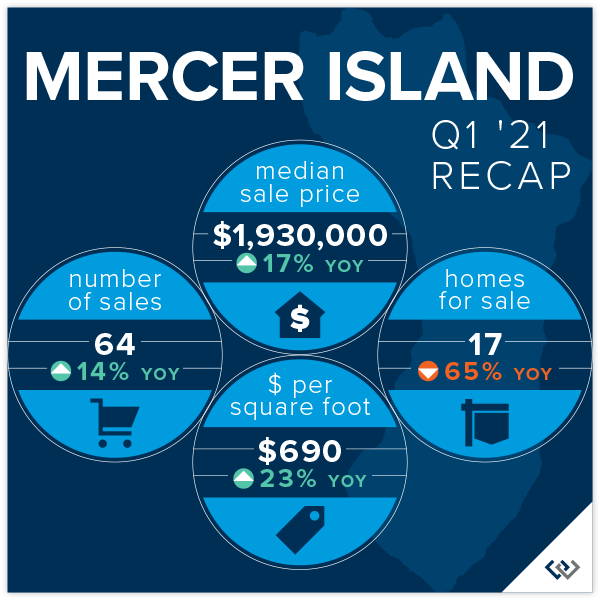
MERCER ISLAND
Most notable on the Island was the continued lack of affordable housing options with no sales below $1 million, and only 10 sales below $1.5 million, in Q1. High end sales dominated the market with 30 of the Island’s 64 sales of homes priced $2 million and above. Mercer Island waterfront listings remained depleted with an average of 2 waterfront homes for sale at any given time and a mere 3 sales in all of Q1.
Q1 saw an average of only 17 homes available for sale—an unbelievable low for a typically burgeoning Q1 on the Island. This has led to a continued ultra-competitive market for the most desirable homes, especially those offering one-level living, a main floor owner’s suite or prime waterfront.
A staggering 81% of all homes sold at or above their listed price and those that sold in the first 10 days (75% of all sales) closed for an average of 110% of their listed price. That increase equated to sellers receiving an average of nearly $200,000 above their listed price at Island’s median sale price.
Click here for the full report and neighborhood-by-neighborhood statistics!

CONDOS – SEATTLE & EASTSIDE
Condos have remained an attractive and more affordable option for entry-level buyers who might otherwise rent. As single-family home markets become more competitive, condo ownership becomes a more compelling—and many times the only—option for those wishing to begin their homeownership journey.
While the number of single-family homes for sale has been on the decline regionally, Seattle condos experienced a 45% increase in the number of units for sale while Eastside condos saw 23% fewer units for sale compared to Q1 2020. Both Seattle (+18%) and the Eastside (+30%) saw an increase in the number of Q1 sales.
Seattle condos saw a 3% increase (to $476,000) and Eastside condos saw a 9% increase (to $535,000) in Median Sale Price compared to Q1 2020. Fueled by new construction townhome development, South Seattle posted a 56% increase in its Median Sale Price during that same period. On the Eastside, with townhomes providing a solid alternative to lacking single-family homes, Sammamish was a standout with a 16% increase over Q1 2020
51% of Seattle condos and 70% of Eastside condos sold at or above their listed price. Those that were sold in the first 10 days (35% of Seattle and 55% of Eastside sales) sold for an average of 103% of their listed price.
Check out area-by-area details the full condo report.

WATERFRONT
With a meager combined average of only 7 homes for sale (compared to 26 in Q1 2020) Mercer Island and Eastside waterfront headlines could only read that there was nearly nothing available for sale in Q1. The Seattle market was just above typical inventory levels (with an average of 12 homes for sale compared to 10 in Q1 2020) while Lake Sammamish maintained its two-year running low of 5 homes for sale.
While many waterfront homes went under contract in mere days, they did not see the dramatic price escalations in Q1 that the more affordable, non-waterfront market has experienced. In fact, only one sale closed at (a fraction of 1%) above its listed price. While 4 of the 14 Q1 sales closed at 100% of their listed price, a fair amount of price negotiation was far more common.
This top-level overview of the entire Seattle-Eastside private waterfront market, including Mercer Island and Lake Sammamish, provides a glance into the trends occurring in our region over time. It is interesting, and insightful, but in no way replaces an in-depth analysis on waterfront value provided by a savvy broker with years of local waterfront experience.

We earn the trust and loyalty of our brokers and clients by doing real estate exceptionally well. The leader in our market, we deliver client-focused service in an authentic, collaborative and transparent manner and with the unmatched knowledge and expertise that comes from decades of experience.
© Copyright 2021, Windermere Real Estate/Mercer Island. Information and statistics derived from Northwest Multiple Listing Service and deemed accurate but not guaranteed.
Should I Be a Homebuyer in this Market?

Fourteen offers, all contingencies waived, earnest money deposit released to seller on offer acceptance. This is the norm rather than the exception in our current market. Sound crazy? It is! And we’ve been here before. Today’s buyers are likely paying considerably above market values to “win” the war and snag a house that they can live with for the foreseeable future. So long as prices keep increasing and demand is insatiable, that gamble might pay off nicely.
But eventually, something has to give. We know this because market cycles are inevitable. They keep our economy healthy and in check. If for example, mortgage interest rates increase too quickly, home prices become too unaffordable, or local or national events significantly impact consumer confidence, the market can turn on a dime. When it does, someone always gets left holding the bag (or an unsaleable house) as the market shifts from a seller’s market to a buyer’s market.
You might be wondering why a real estate company is suggesting you think twice before making the plunge. The truth is, we’re in it for the long haul and we know informed buyers are the best buyers. If you are a home seller wondering if we just showed your cards, fear not—having an informed buyer who has done their homework means they’re more likely to follow through to closing (and less likely to seek retribution from you later because of unknown or undisclosed defects). Read on!
FIRST THINGS FIRST
You know yourself and your situation better than anyone else. You need to be financially comfortable with the monthly payment, down payment, and ongoing costs of home ownership (see Should I Rent or Buy a Home?).
You will also want to consider whether an unexpected relocation could be in your near future. Do you feel secure in your employment situation? Knowing you could comfortably stay put and ride out the storm of any downturn in the market protects you considerably compared to being in a must-sell predicament. If you feel unsure about your financial position or might be required to relocate in the next couple of years, now might not be the right time for you to buy.
Your broker will be able to recommend prominent local lenders, inspectors, and other necessary vendors. Do your homework to select the right lender for you and make formal loan application with them to obtain underwriting approval. Beyond just pre-approval, underwriting approval assures you that your loan will go through (unless your employment situation changes or there is an issue with the house itself). This is well worth the time and effort to accomplish. While you’re at it, research potential inspectors to determine who you think will do the best job and what their options for completing an inspection within a tight timeline are.
If cash offers or those with waived financing contingencies are commonplace in the area you are searching, explore alternatives for funding your purchase. In addition to getting pre-underwritten, can you temporarily borrow funds from a 401k, investment account, or line of credit to allow you to better compete with cash? Do you have other interim options that would allow you to get in the door and obtain a purchase mortgage loan post-purchase? There are many nuances to making this work, but it might just be worth investigating if it is right for you.
Consider your risk tolerance level. This is something only you can determine, and everyone will have a different baseline. If you’ve checked off the items suggested above and decided you are financially and emotionally ready to get in the ring, how do you protect yourself when buying a home in an extreme seller’s market? Read on for things you can do to put yourself in the best possible position when buying a home—even in an ultra-competitive market. In this article, we will focus on critical aspects of the home itself and the home-specific research you should do before submitting an offer.
ASPECTS TO CONSIDER BEFORE YOU GET INTERESTED
Here are four attributes, beyond the number of bedrooms and baths, that you should have your eye on. Many buyers overlook undesirable aspects of a home when there are few choices, however “Grade A” properties will have the highest resale potential even in a future buyer’s market.
Home (building) quality: Well-built homes with “good bones” will outlast mediocre quality homes (and their components and systems) any day of the week. Determining quality is somewhat subjective. You will notice it in well-designed details, cabinetry and components that stand out from the competition. If the home has had renovations, do they match or exceed the quality of the original structure? Granted, affordability will impact quality, but it is critical to size up any home you are considering so that you’re comparing apples to apples. You don’t pay the latest iPhone price for a no name brand phone, and the same applies here. If you purchase a fair quality home at the going rate of higher quality homes, you are likely overpaying.
Immediate to-dos and deferred maintenance: Different than quality, a home’s upkeep requirements include the to-do list of items that need to be done to maintain its integrity. A home that has been well maintained over its life typically is a better investment than one that hasn’t. The true cost of deferred maintenance often adds up to more than the cost of the repairs themselves. Don’t forget to factor in the reduced life span of other components—like replacement of damaged wood beneath peeling paint or mold remediation in a damp basement caused by a clogged foundation drain. Also consider that if you know the furnace, roof, and exterior haven’t been properly maintained, what else also hasn’t been maintained that you don’t know about? Be careful to look past any “fluff” that may have been quickly done to prep the home for sale. See the Home-Specific Due Diligence below on how you can assess this before writing your offer. This article on Assessing the Real Cost of a Fixer is also a great resource.
Setting: The saying “location, location, location” didn’t get its fame from nowhere. A home with an ideal setting on its lot and in the neighborhood—away from busy roads and utility poles/boxes, with adequate privacy, good topography, best positioned to capture views if available, and not adjacent to undesirable elements—will have more value than a less-ideally situated home. Builders do this with lot premiums in new developments. When deciding what to pay for a property it is critical that you evaluate these aspects and any others relevant to a specific neighborhood to determine the +/- effect on value as compared to other recent sales.
Floor plan: How a home lives—flow from room to room, size of rooms, open/closed-off spaces, and below ground vs. above ground living—are every bit as important as the total home square footage. You can change a lot of things about a home, but it is more difficult to change a bad floor plan. Ensure that the floor plan is one that will work for you for the foreseeable future. That might mean more available bedrooms than you currently need, the structural ability to easily expand, or one-level living to allow you to age in place. When you are deciding a home’s potential value, consider the future relevancy of the floor plan for your lifestyle.
HOME-SPECIFIC RESEARCH
A great home hits the market and buyers are already lined up make an offer. It looks like an “A” property or something close. The clock is ticking, and you don’t want to lose out (again). Rather than getting caught up in the frenzy, take a deep breath, keep your wits about you and get to work. There is so much intel you and your broker can gather to ensure that the home you are considering won’t turn into your worst nightmare. Time is of the essence, so this is something you will want to do expeditiously.
Property photos and info: Of course, everyone looks at the home photos as soon as a new listing hits the market. Consider pulling them up on a big display and looking closely at things like room flow; condition of windows, floors, and major components like the roof and exterior; floor plan; proximity of neighboring properties; sun exposure; and topography. There is so much you can see when you are specifically looking for it. Don’t forget to check the description for key requirements that you can’t live without. Closer scrutiny of the info available before you go further will help you avoid wasted time.
Online research: Check out online maps of the street, neighborhood, and surrounds. Are there major roads or freeways, high voltage power lines, adverse topography, or other concerns that might affect your decision? Are there parks or other amenities that make this home more compelling? Is it located in an area with good cell coverage and high-speed internet? Even in our tech-oriented world, you’d be surprised how many pockets of inadequate coverage exist in our region. You can research this info, public records, and more using the Research tab on our website. This is a great first step in researching a home before you even jump in your car.
Property history: A simple search of the home address will bring up the listing and sale history on broker search websites. Your buyer broker can also access detailed listing, sale, and transfer history going back two decades or more. Use this information to better understand the property’s past. Was it recently sold as a fixer? Previously a foreclosure? Is it a flip? Those don’t necessarily eliminate a property, but they do add the need for another level of scrutiny. Do the previous photos or descriptions indicate non-permitted remodeling or otherwise warrant concern? What recent listings and sales have occurred in the vicinity? Do they support this home’s value? This will help you get a better picture of any home you are considering.
Seller disclosures and seller-procured inspections: With few exceptions, home sellers have had to disclose known defects and issues for more than three decades now via a Real Property Transfer Disclosure Statement aka Form 17. This document is typically uploaded to the listing and accessible to your buyer broker. Like everything you have done to this point, a close review of this disclosure lets you know more about this home. See Seller Property Disclosure: What You Need to Know Before You Buy.
Given the many components that make up a structure, every home will have some disclosed issues. If there are none, that should be a red flag itself. If the seller hired an inspector to conduct a pre-inspection, it will be noted in the disclosure and the inspection should be made available for your review. You are looking for a better understanding of past issues, resolutions, current issues, and ongoing concerns that might require further research.
Visiting the home: You’ve done your homework, and everything looks good so far. Take a drive by the home and neighborhood while you are waiting for your showing appointment to visit the home in person. While you are in the home, assuming it checks your boxes and you want to move forward, take a few minutes to take closer notice of typical problem areas. Here is a great guide on How to Spot Big Issues Before You Pay for a Home Inspection.
Buyer pre-inspections: A home inspection offers invaluable information on not only the current condition, but also on ongoing maintenance needs and items to be mindful of so they don’t become a bigger problem later. Unlike waiving most other contingencies in a purchase offer, where the worst that could happen is you lose your earnest money deposit, buying a home without an inspection could cost you tens or hundreds of thousands in unexpected repairs after closing. Here is a great home buyer book written by a local home inspector: The Confident House Hunter: A Home Inspector’s Tips for Finding Your Perfect House.
Let’s be honest, pre-inspections are hard to get scheduled right now. Sellers and listing brokers are just trying to get everyone in the door to see the home and blocking out a big chunk of time for a pre-inspection is often a challenge. With a little planning and coordination, here are some potential solutions to this challenge if scheduling an inspection during normal hours is not possible: see if the seller will allow a two-hour inspection at 7 am before the day’s showings; ask about conducting an inspection during a time when someone else is already inspecting (assuming all parties can properly distance and are okay with this); if all else fails, ask your inspector if they would consider reviewing any seller pre-inspection to help you assess its completeness.
In a less competitive environment, you might be able to simply include an inspection contingency with your offer. Also, don’t forget about wells and septic tanks. They’re kind of essential to you actually living in the home and having a non-performing well of a failed septic system is a bigger dilemma than you might imagine.
FINAL THOUGHTS
You’ve done what you need to do to investigate the property as thoroughly as possible and you want to proceed. Now is the time to determine if this is a “have to have” or “nice to have” home based on others that you’ve seen and strategize your offer accordingly. You might decide to waive typical contingencies and release all or part of your earnest money to the seller to make your offer more competitive. While there is no doubt a degree of risk in doing this, if you’ve done your due diligence ahead of time, this can be a compelling approach that doesn’t cost you any more at the closing table.
Of course, it is essential to have a competent real estate broker who can help you navigate these waters, determine the value (as compared to similar properties), history (permits, prior sales, etc.), and activity (other offers, pre-inspections, expressions of interest) of potential properties you are interested in. This helps you go in armed with the information to make sound decisions with a clear offer strategy that will help you win far more effectively than the typical guesswork that goes in too many offers written without this guidance.
Working with a reputable broker also makes for a more reputable offer. Any seller is looking for the assurance that their sale will close on time and as agreed. Most sellers feel more comfortable accepting an offer when there is good communication, a solid realtor, and a knowledgeable buyer behind it.
Lastly, be prepared for the adventure. There will be joy, surprise, heartbreak, anger, frustration, and bliss along the way. If you go in knowing it will be a challenge, you’ll be much better prepared for the market we are currently faced with.
Still have questions? Contact one of our knowledgeable brokers for assistance with how to purchase, sell, or determine the value of any property you are considering.
Find a Home | Sell Your Home | Property Research | Neighborhoods | Market Reports | Our Team
We earn the trust and loyalty of our brokers and clients by doing real estate exceptionally well. The leader in our market, we deliver client-focused service in an authentic, collaborative and transparent manner and with the unmatched knowledge and expertise that comes from decades of experience.
© Copyright 2021 Windermere Mercer Island.
Waterfront Defined

Terminology
These local definitions will not only to help you know the lingo when it comes to waterfront speak, but to give you quick access tools to research waterfront to your heart’s content. Here is a quick resource to commonly used terms related to waterfront real property:
Bluff Most beaches on Puget Sound are backed by bluffs. These bluffs can vary from spectacular, high eroding cliffs to low, vegetated banks. The erosion of bluffs is a significant source of sediment on many Puget Sound beaches. One way of classifying bluffs is by the amount of sediment they provide to local beaches as they erode. This is based on how fast they erode, how high they are, and how much sand and gravel they contain. In these maps, bluffs are assigned to the following categories: Exceptional Feeder Bluffs; Feeder Bluffs; Feeder Bluff – talus; and Transport Zones. This Department of Ecology Feeder Bluffs and Coastal Landforms Map is a great tool for identifying bluff categories.

Boathouse A building designed for the storage of boats or watercraft to provide protection from the elements. The building of boathouses is generally prohibited under current environment regulations, but many grandfathered boathouses remain throughout the region.
Bulkhead A solid or open pile wall of rock, concrete, steel or timber or other materials or a combination of these materials erected generally parallel to and near the ordinary high water mark for the purpose of protecting adjacent wetlands and uplands from waves or currents.
Dock A raised walkway over water, often supported by widely spread pilings or pillars. Recent dock requirements encourage the use of decking structures and systems that encourage light and air flow to the water below. Also referred to as a pier.
Dock inspection A structural and functional evaluation by an individual or company who specializes in dock construction and repair. This can involve an underwater dive evaluation when portions of the supporting structure is in question or unobservable from above.
High bank waterfront Land that sits substantially above the natural water line, making the waterfront inaccessible without stairs or other structures, if at all.
Low bank waterfront Land that sits just above the natural water line, often delineated with a bulkhead protecting the shoreline. Low and no bank waterfront abutting a navigable lake is often considered the most desirable waterfront in the Puget Sound region.
Medium bank waterfront The most subjective of terms, this represents moderate bank land that is lower than high bank and higher than low bank waterfront.
Moorage A place where a boat or ship are secured in the water. As it pertains to waterfront real estate, this is typically on a privately owned dock or boathouse.
Navigable water “Navigability or navigable” means that a body of water is capable or susceptible of having been or being used for the transport of useful commerce. The state of Washington considers all bodies of water meandered by government surveyors as navigable unless otherwise declared by a court. See Who Owns the Water?
No bank waterfront Land that graduates out to the natural water line without a bulkhead separating it from the shoreline. Often described as rolling waterfront, its spacious feel at lakeside is highly desirable.
Ordinary High Water “Ordinary high water” means, for the purpose of asserting state ownership, the line of permanent upland vegetation along the shores of nontidal navigable waters. In the absence of vegetation, it is the line of mean high water.
Pier A raised walkway over water, often supported by widely spread pilings or pillars. Recent dock requirements encourage the use of decking structures and systems that encourage light and air flow to the water below. Also referred to as a dock.
Private Waterfront Land abutting the water owned exclusively by an individual land parcel. Greater waterfront footage and amenities (beach/dock/moorage) create a more valuable parcel than one with limited waterfront footage or amenities.
Shared Waterfront Land abutting the water owned in common (deeded) by owners of other often adjoining, land parcels. Fewer owner shares and deeded amenities (dock access/moorage) create a more valuable shared waterfront parcel than one with many owners or fewer amenities.
Shorelands Land which is alternately covered and left dry by the rising and falling of the water level of a lake, river, or tidal area.
“First class shorelands” means the shores of a navigable lake or river belonging to the state not subject to tidal flow, lying between the line of ordinary high water and the line of navigability, or the inner harbor line where established and within or in front of the corporate limits of any city, or within two miles thereof upon either side (RCW 79.105.060(3)). These boundary descriptions represent the general rule; however exceptions do exist. To determine if the shorelands are within two miles of the corporate limits of a city, the distance is measured along the shoreline from the intersection of the corporate limit with the shoreline.
“Second class shorelands” means the shores of a navigable lake or river belonging to the state, not subject to tidal flow, lying between the line of ordinary high water and the line of navigability, and more than two miles from the corporate limits of any city (RCW 79.105.060(17)). These boundary definitions represent the general rule; however, exceptions do exist. To determine if shorelands are more than two miles from the corporate limits of a city, the distance is measured along the shoreline from the intersection of the corporate limit with the shoreline.
(Public) Tidelands Land belonging to and held in public trust by the state for the citizens of the state, which are not devoted to or reserved for a particular use by law. Typically, the portion of land below the ordinary high water mark and the navigable water. Tide lines have been an area of great controversy in Washington State. Considered public domain through the Public Trust Doctrine. The Public Trust Doctrine does not allow the public to trespass over privately-owned uplands to access the tidelands. It does, however, protect public use of navigable water bodies below the ordinary high water mark.
“First class tidelands” means the shores of navigable tidal waters belonging to the state lying within or in front of the corporate limits of any city, or within one mile thereof upon either side and between the line of ordinary high tide and the inner harbor line; and within two miles of the corporate limits on either side and between the line of ordinary high tide and the line of extreme low tide (RCW 79.105.060(4)). In general, the line of ordinary high tide is the landward boundary. The line of extreme low tide, or the inner harbor line where established, is the waterward boundary. To determine if the tidelands are within two miles of the corporate limits of a city, the distance is measured along the shoreline from the intersection of the corporate limit with the shoreline.
“Second class tidelands” means the shores of navigable tidal waters belonging to the state, lying outside of and more than two miles from the corporate limits of any city and between the line of ordinary high tide and the line of extreme low tide (RCW 79.105.060(18)). In general, the line of ordinary high tide is the landward boundary. The line of extreme low tide is the waterward boundary. To determine if the tidelands are more than two miles from the corporate limits of a city, the distance is measured along the shoreline from the intersection of the corporate limit with the shoreline. Excerpt from the Department of Ecology Public Trust Doctrine.

Waterfront Footage The linear feet that span the water’s edge of a land parcel.
Watershed A watershed is the land area draining to a nearby river or lake, or sound.
Maps
There are many local map portals to assist in identifying topography, water conditions, hazards, and critical areas.
iMap Parcel Lookup Instructions (PDF)
Washington DNR Natural Hazards Geological Maps
Washington Geographic Information Portal Map
Department of Ecology Feeder Bluffs and Coastal Landforms Map
Department of Ecology Wetlands Inventory Map
NOAA Puget Sound Water Depth Chart
Resources
King County
King County currently has about 1200 documented residential docks and 58 private boat ramps (see shoreline land use facts). A permit is required to build, modify, alter the land abutting a shoreline.
King County Shoreline Management Fact Sheets and Links
King County Shoreline Permit Submittal Requirements (PDF)
King County Bulkhead Shoreline Requirements (PDF)
Shoreline Site Plan Requirements (PDF)
King County Shoreline Property Owner Resources
King County Lake Services and Information
Puget Sound Shoreline Stewardship Guidebook
King County Water and Shorelines Glossary
Washington State
Washington State (RCW) Aquatic Land legal definitions
DFW – Your Marine Waterfront (PDF)
DNR – Puget Sound and Coastal Geology
DNR – Puget Lowland Geological Province
Dept of Ecology – Mapping Bluffs and Beaches of Puget Sound (PDF)
WSU Guide for Shoreline Living (PDF)
UW Puget Sound Fact Book (PDF)
Environmental Protection Agency
Shoreline and Wetland Tools and Resources
King County watershed overview map
Cedar River – Lake Washington Watershed (Lake Washington waterfront properties)
Central Puget Sound Watershed (North/West Seattle waterfront on Puget Sound)
Green-Duwamish River Watershed (South Seattle waterfront properties on Puget Sound)
Sammamish Watershed (Lake Sammamish waterfront properties)
National Oceanic and Atmospheric Administration
ERMA visualization map of Puget Sound
Bluffs, landforms and habitat classifications
The Watershed Company (site evaluation contractor) Articles
A home buyer’s guide to property with critical areas
Shoreline planning and permitting
We hope this provides an outstanding starting point in your waterfront journey. In addition to this specific research, don’t forget to evaluate all the typical aspects of your potential new home and neighborhood. We’ve compiled links to research tools from schools and geological hazards to market reports and census data.
While you’re there, you can also look up neighborhood info, including crime reporting, local government resources, parks and recreation, and school boundaries.
Of course, nothing tops having an experienced broker to guide you through the process. They’ve seen hundreds upon hundreds of homes and can help you identify the solid finds from the duds with gorgeous looking veneer.
Choosing the right broker can save you thousands on your home purchase. Whether through local market knowledge and pricing analysis allowing you to make a smarter offer, recommendations and resources to thoroughly conduct your due diligence and avoid costly mistakes, or savvy contract negotiation to help you get the terms you need, having a Windermere broker on your side is one advantage you can’t afford to sacrifice.
Find a Home | Sell Your Home | Property Research | Neighborhoods | Market Reports | Our Team
We earn the trust and loyalty of our brokers and clients by doing real estate exceptionally well. The leader in our market, we deliver client-focused service in an authentic, collaborative and transparent manner and with the unmatched knowledge and expertise that comes from decades of experience.
© Copyright 2020 Windermere Mercer Island.
Assessing the Real Cost of a Fixer

It can be very compelling to find a home in a neighborhood you like that is bargain priced. But how do you know if it will be a good investment? The only certainty in a fixer project is that there will be a substantial amount of uncertainty and risk. There can be significant rewards too, which is why the call of a fixer is so loud for opportunistic buyers.
Here are a few guidelines to determine how much how much to offer and whether a fixer is the right house for you.
Step 1: Determine the initial scope of work
Make a list of the most obvious items to be addressed. Decide which items are within your skill set to accomplish yourself and which ones need to be contracted out. Spend some time calling contractors and researching each item to get a ballpark idea of the cost to complete—either the raw materials expense to DIY or the contractor’s price to do it for you. Calculate in an additional 20% for unexpected issues and cost overruns. Add these to a spreadsheet along with the time each project should take. Keep in mind this is an initial evaluation intended to be done before you invest too much time and money into negotiation or inspections.
It’s well worth spending a few minutes talking to the city or county building department to verify which work requires a permit and what the cost and process is before proceeding. Don’t forget to calculate in the cost of obtaining permits for electrical, plumbing, major remodel, or structural changes into your total budget. Getting permits can be time-consuming but doing work without a permit will ultimately create bigger problems when you go to sell because lenders and buyers will want verification the work was permitted and completed properly.
Step 2: Do a reality check
Do you have the readily available cash or an approved line of credit to fund this project plus any cost overruns? Do you have the skills and patience to manage or complete the renovation work? Are you able to fit the work itself or the oversight of contractors into your current life schedule without compromising your life values? Will the time and money you invest be worth it in the end product? Are you willing to live in a construction zone while work is being completed?
Don’t skip this step! The answer to these questions will be different for everyone. Some people take on a project because it pencils out without fully evaluating what the impact on their lifestyle will be. A savvy fixer buyer will go in with full awareness of what they are taking on and the project will be much smoother as a result.
Step 3: Determine your offer price and strategy (and max purchase price)
This is where your broker can be an invaluable resource. They can assess a home’s as-is market value and also its potential finished value. Calculating in the costs you identified in step one—including the 20% for unexpected issues and cost overruns—will give you an idea of your max purchase price. Don’t forget to consider expenses like the cost of living elsewhere during renovations, the inconvenience of living through a remodel, and the value of your time invested.
From there, your broker can evaluate market activity and present options for offer strategies, including an initial offer price. Your offer should always include an inspection and sewer scope or septic contingency unless you’ve completed them before making an offer. Here are additional contingencies you may want to include to protect you in your purchase.
Step 4: Don’t skimp on the inspection
Assuming you’ve decided that you and your pocketbook are up for the challenge, the next step is to hire the best inspector you can find to make a thorough assessment of the home. If there is obvious deferred maintenance you can see, there are likely to also be many other issues you can’t see. A good inspector will identify those and provide insight into the overall structural condition of the home. Well-built homes with “good bones” make much better rehab projects than homes of mediocre quality.
Don’t forget to scope the sewer line or evaluate the septic system. Both are potentially big-ticket items that don’t add any visible value to your finished product. If you are in an area that may have had oil heating at one time, also confirm there are no underground oil tanks remaining.
If major structural issues are identified or there are indications of problems that cannot be fully investigated, think seriously about proceeding without getting permission to have a structural engineer or general contractor investigate further.
Final thoughts
By thoroughly completing your due diligence, you can mitigate much of the risk associated with purchasing a fixer. Having remodeling skills or connections to outstanding contractors is critical. Lastly, if this is your first-time renovating a home, purchasing a home that is simply tired and dated rather than having significant deferred maintenance or structural issues will help you keep your project in the black.
Still have questions? Contact one of our knowledgeable brokers for assistance with how to purchase or determine the value of a potential fixer.
Find a Home | Sell Your Home | Property Research | Neighborhoods | Market Reports | Our Team
We earn the trust and loyalty of our brokers and clients by doing real estate exceptionally well. The leader in our market, we deliver client-focused service in an authentic, collaborative and transparent manner and with the unmatched knowledge and expertise that comes from decades of experience.
© Copyright 2020 Windermere Mercer Island.
Should I Rent or Buy a Home?

It’s important to remember that the purchase or rental of a home is a lifestyle choice as much as it is an investment. It is not just a commodity to negotiate, but also the place you’ll come home to each day and make your own. Yes, it is important to buy wisely and stay within your means. It is equally as important to do what is right for you and your lifestyle now. If you know you’ll be staying in the same place for years to come, you have much more latitude than you would if you might need to relocate in the next couple of years.
As you evaluate your options, you’ll want to consider things like initial out-of-pocket expenses, monthly expenses, maintenance and upkeep costs, tax deductions, and appreciation.
Initial out-of-pocket expenses.
In a home purchase, this is the down payment & closing costs. Depending on the loan program and purchaser’s credit rating, a typical down payment is 5-20% of the purchase price with closing costs (loan, title and escrow fees) adding another 2-3% on top of that. Putting 20% or more down allows you to avoid the added cost of mortgage insurance. If you need to put less down, you can remove the mortgage insurance later when you have 20% or more in equity.
In a rental, this is typically first month’s rent plus security deposit.
BUY: A $500,000 home with 10% down would cost $65,000 ($50,000 down and $15,000 in closing costs) in initial out-of-pocket expenses.
RENT: A $3,000 per month rental might cost $6,000 (first month’s rent and security deposit).
Monthly expenses.
In a home purchase, this is the mortgage payment (including property taxes, homeowner’s insurance and any mortgage insurance). In a rental, this is typically just the rent.
BUY: A $500,000 home with 10% down works out to a $2,084 base mortgage payment on a 30-year fixed mortgage. Add around $500 in property taxes, $50 in homeowner’s insurance and $290 in mortgage insurance (if applicable) for a total of $2924 per month.
RENT: $3,000 per month.
One important consideration is that the base monthly payment in a purchase of a 30-year fixed mortgage does not increase (although the property taxes and homeowner’s insurance will). Rent will likely increase each year to keep pace with inflation. Over time, the amount paid in rent each month will typically become significantly more than the amount of a mortgage payment.
Maintenance and upkeep.
In a home purchase, you are responsible for everything from the roof to the foundation, plus the land, utilities and sewer lines. In a condo, you are individually responsible for the interior of your unit and collectively responsible for the entire structure and grounds. The cost of maintenance depends on the age of the home or condo, how well it was built and maintained, and its exposure to the elements. In a rental, the landlord pays for maintenance and upkeep.
BUY: Plan for 1-2% of the home’s value per year in typical maintenance plus the cost of major components (roof, furnace/AC, paint, flooring, appliances, decks, etc.) based on their life span. These items are easily researchable via inspectors, contractor bids and even google searches.
RENT: Landlord pays for maintenance and upkeep.
Appreciation.
In a home purchase, your investment is leveraged. That means you gain appreciation based on the entire value of your home, not just the amount you put down. That’s like earning interest on $500,000 even though you only deposited $65,000 in the bank.
BUY: A 4% appreciation rate is a good average to benchmark. Assuming a 4% rate of appreciation per year, our $500,000 home would gain $108,000 in value over five years.
RENT: The landlord gains the appreciation.
The bottom line.
There’s a lot more to consider than just the monthly outgo. A homeowner can maximize their investment by purchasing in a highly desirable area and completing timely maintenance and upgrades or they can waste away their equity by purchasing in a declining or over-built area and allowing their home to fall in disrepair.
Only you know you. Are you up for the pleasure, independence, headache, and heartache of owning your own home? Or would you prefer the comfort and ease of renting someone else’s home with no strings attached, even if it costs more over time? Building wealth through homeownership is an incredible opportunity—but it’s only worth it if you enjoy the ride.
Looking back at the numbers, here’s how a 5-year analysis might pencil out:
BUY: Your $500,000 home costs about $65,000 in initial out-of-pocket expenses, about $180,000 in monthly payments, and $40,000 in maintenance and upkeep over 5 years for a grand total of $285,000. In our scenario, this is offset by $108,000 in appreciation for an estimated net cost of $177,000 over five years.
RENT: An initial $3,000 per month rental would cost $194,988 in rent payments over 5 years assuming a 4% rent increase each year (a good long-range, though very conservative, benchmark, given the double digit rent increases over the past several years).
So, there you have it. The decision to opt for home ownership is a lot more than a quick judgement call. To do it right, you have to consider all of its aspects—financial, emotional, and even physical and spiritual—and weigh those against your long-range goals and plans. By taking the time to do a thorough analysis of the numbers and an assessment of yourself, you’ll make the best decisions possible and avoid costly mistakes.
Still have questions? Contact one of our knowledgeable brokers for assistance with how to determine your best sale price based on both the average and median price trends.
Find a Home | Sell Your Home | Property Research | Neighborhoods | Market Reports | Our Team
We earn the trust and loyalty of our brokers and clients by doing real estate exceptionally well. The leader in our market, we deliver client-focused service in an authentic, collaborative and transparent manner and with the unmatched knowledge and expertise that comes from decades of experience.
© Copyright 2020 Windermere Mercer Island.
The Right Timing Can Bring You Thousands More When You Sell

Ever notice how one home on your street sells well above asking price with a line of buyers out the door and an identical home comes on a month later and sits on the market for two weeks before finally selling at a reduced price? Every. Day. Counts.
It’s not always about the house. It’s also about timing the market well. In a world where potential buyers know how long you’ve been on the market down to the minute, being on the market a nanosecond longer than expected can be painful for any seller, financially and otherwise. Statistically, at mainstream price points, prices seem to peak around Day 7 and begin to slide downhill after Day 10.
How to time the market in a nutshell.
Avoid coming to market during major holiday weeks. Potential buyers take vacation too—and the fewer buyers out there looking in those precious early days, the lower the likelihood you’ll sell in the first 10 days. Look to come on the market a few days after typical vacations are over to allow buyers to re-engage in the search process. Avoid coming to market when a similar house in your neighborhood has just listed and not yet sold.
The laws of supply and demand would dictate that when supply appears abundant, demand diminishes—and the days tick on by. Even if you are by far the better house and at a better price, you might still be hurt by the curiosity around why everyone is selling now.
Avoid coming to market during bad weather or local events. Like coming on market right smack in the middle of graduation week, listing when everyone’s attention is on something other than home shopping is likely to miss the mark big time. Even if you were all set to list on a particular date, it might be better to take a deep breath and wait until the storm passes.
Do come to market when you notice an absence of great listings for sale in your price range and neighborhood. Buyers will likely feel that void too and be chomping at the bit for the next great home to come along. The chances of a perfect match between a solid buyer and a reasonable seller are best in this zone.
This is especially true if your home has challenges (outdated design, deferred maintenance, busy street, steep slope, etc.) that would make it difficult to compete with other homes out there. On the flip side of that coin, if your home is exceptional, you want to be on the market during peak season when buyers can size up your home to the competition and appreciate how much better your home is. Buyers will pay handsomely for turnkey quality when they can clearly see the difference. Come on when there is nothing else to compare to and your beautiful amenities might not see their full value potential.
The best days to come to market are Tuesday, Wednesday or Thursday. This allows for showings and open houses on evenings and throughout the weekend. If you are doing an offer review date, the best day to review offers is Monday or Tuesday. This gives buyers ample time to see your home, conduct their due diligence, complete a home inspection and sewer scope, and get their financial documentation together—all before they prepare an offer.
Final thoughts.
Look at the holiday calendar and local school district calendars to guide you toward best weeks to come to market. Don’t forget to check in big political and sporting event dates too.
Decide whether your home will shine against the competition, or be the wallflower, and adjust your timing based on real-time competition.
Of course, an outstanding listing broker can help you choose the most favorable date to bring your home to market. They analyze the market consistently and know exactly what indicators to look for. Still have questions? Contact one of our knowledgeable brokers for assistance with determining the best market timing for your home.
Find a Home | Sell Your Home | Property Research | Neighborhoods | Market Reports | Our Team
We earn the trust and loyalty of our brokers and clients by doing real estate exceptionally well. The leader in our market, we deliver client-focused service in an authentic, collaborative and transparent manner and with the unmatched knowledge and expertise that comes from decades of experience.
© Copyright 2020 Windermere Mercer Island.
Key Buyer Protections You May Need for Your Home Purchase

When purchasing a home, there are a number of protections—called contingency clauses—that you can write into your contract to allow you to back out of the sale for specific reasons. For instance, if your inspection reveals major problems with the home that the seller can’t or won’t fix, your loan financing falls through, you find out the HOA rules or neighborhood weren’t what you were expecting, etc. The sheer quantity of available contingencies is dizzying. Our list includes 26 provisions alone on preprinted forms, not including any specific requests your broker might negotiate in.
Clearly, not all contingencies are used in a typical transaction and many make your offer less competitive. Still, we think it’s critical for you to understand the legal implications and trade-offs of each contingency so you can make the smartest decisions possible.
Financial
We’ll start with contingencies that relate to financing. Except in extremely competitive situations or non-financeable home sales (think dilapidated homes, major structural issues, or land-value sales), a financing contingency is relatively commonplace. It generally protects you in the event you can’t secure a loan (provided you follow the agreed upon protocol). It includes an appraisal contingency to protect you in the event the lender feels the homes is worth less than you agreed to pay for it.
If you have an existing home that needs to close before you can complete your home purchase, there are two standard contingencies available to you. The first, Buyer’s Sale of Property Contingency, is used when you have not yet secured a buyer for your current home. It sets time periods to both actively list your home for sale and to secure a buyer contract. It ties the closing of your new home to the closing of your current one, and because of this, sets very specific protocols for accepting an offer. It has a bump provision that allows the seller to accept a non-contingent offer if you don’t remove your contingency within a predetermined time frame.
The second contingency, Buyer Pending Sale of Property Contingency, is used when you have already secured a buyer for your home and are awaiting its closing. Because your home is already under contract it is far less controlling than the Sale of Property Contingency, but it protects you if your first sale falls through.
Less common financial contingencies include a standalone appraisal contingency available for cash transactions, a seller-financing attorney review, and a contingency related to homeowner’s insurance availability.
Home and Property Condition
In highly competitive situations a buyer may need to conduct their due diligence before making an offer. In most other scenarios, though, the buyer has countless opportunities to investigate a potential property and walk away or renegotiate if it doesn’t measure up to expectations.
The inspection contingency includes the ability to evaluate the structural, mechanical, and general condition of the structure(s), compliance with building and zoning codes, an environmental or hazardous materials inspection, a pest inspection, and a Geotech or soils and stability inspection. In addition, it includes the option to allow a sewer system inspection or a neighborhood review and permits an inspection to determine the presence or non-presence of oil storage tanks on the property.
Specific separate contingencies allow for evaluation and review of documentation related to wells and septic systems, assessment the presence of lead-based paint, or review of lease agreements for components like propane tanks, security systems, and satellite dishes, etc.
There is an option to make the sale contingent upon seller providing a home warranty or require cleaning and personal property removal prior to buyer taking possession.
Buyers wanting to determine if a home or property is suitable for their intended use (think building, remodeling, platting or development) would incorporate a feasibility contingency into their offer. Buyers of vacant land might include the Land and Acreage Development and Use addendum that incorporates both disclosures and contingencies.
Built into the standard local purchase and sale agreement is an Information Verification Period that gives the buyer 10 days (unless modified) to verify statements made by the seller of listing firm related to the property.
Title
In Washington State, the buyer most commonly receives a deed at the time they purchase a property. That deed is subject to financial liens and encumbrances, restrictions, and physical encroachments. A standard title review contingency allows the buyer the opportunity to review these items and object to any they cannot live with. A buyer has the option to complete a survey of the property boundaries and purchase extended title insurance if desired. Surveys are exceedingly expensive and most typically completed on valuable parcels of land such as waterfront and commercial property.
Community and Homeowners Association
Many communities have homeowner’s associations that govern rights and responsibilities within a community. A homeowners’ association review contingency requires the seller to deliver documents and meeting minutes to buyer that are then subject to buyer’s approval.
Condominiums and Common Interest Communities are also regulated by statute and have specific requirements for review and approval of budgets, documents and meeting minutes like traditional contingencies. Although governed by statute, it’s important for buyers to ensure they receive and review the resale certificate or public offering statement within the allotted time frame to avoid an automatic waiver.
Perhaps you are making an offer in a community or neighborhood you know nothing about and don’t have enough time to check it out. A neighborhood review contingency allows you to do things like research crime statistics, talk with neighbors, explore traffic patterns, and check the noise level (nothing like finding out about that incessantly barking dog after closing). This is something that ideally you do before writing your offer to make it as strong as possible, but it’s nice to know its available in a pinch.
Leases
When buying a property subject to an existing lease that will continue after closing, a lease review contingency will require the seller to deliver a copy of the lease along with books, records and other agreements and provide for your review and approval within a specified time frame.
Attorney Review
Finally, an attorney review contingency will allow you a defined time period with which to have your attorney review and approve specific provisions or the entire purchase contract.
No two homes, buyers, or sellers are the same. Every offer you write should be tailored to the specific situation. Nothing tops having an experienced broker to guide you through the process. This is what we do every day. Together, we’ll create the best strategy for you.
Choosing the right broker can save you thousands on your home purchase. Whether through local market knowledge and pricing analysis allowing you to make a smarter offer, recommendations and resources to thoroughly conduct your due diligence and avoid costly mistakes, or savvy contract negotiation to help you get the terms you need, having a Windermere broker on your side is one advantage you can’t afford to sacrifice.
Find a Home | Sell Your Home | Property Research | Neighborhoods | Market Reports | Our Team
We earn the trust and loyalty of our brokers and clients by doing real estate exceptionally well. The leader in our market, we deliver client-focused service in an authentic, collaborative and transparent manner and with the unmatched knowledge and expertise that comes from decades of experience.
© Copyright 2019 Windermere Mercer Island.


